Summary – This post presents a synthesis of the results of a project carried out by Yassine Abdelouadoud and coordinated by myself at the PERSEE centre of MINES Paris PSL. In this project we developed a method for assessing the cost of reinforcing the electricity distribution grid to accommodate photovoltaic plants (both at low voltage and at medium voltage). The method combines two kinds of modelling. The first is a peak-based model that estimates the reinforcement needs induced by PV integration. The second is a dynamic model that computes the energy that would actually be curtailed if flexibility were used. To keep the computational burden manageable, the approach is applied to a selection of 150 medium-voltage feeders whose representativeness has been validated. The method was applied to several levels of renewable penetration (see the figure above), to various combinations of plant types (large ground-mounted plants, large rooftops, small rooftops), and with or without the use of flexibility. The project was funded by France Relance and by Roseau Technologies. The final report describing the methodology and the full set of results is available here. A few key takeaways:
- the cost of 150 GWp scenarios stays below €150/kW; that is more expensive than today, but for large ground-mounted plants the total project cost is around €800/kW (see for instance the CRE report).
- Flexibility matters: it halves the costs when targeting more than 100 GWp.
- The cost depends on what is installed and where the plants are sited. Building more large ground-mounted plants does not increase reinforcement costs, contrary to what is often claimed.
- Going up to 250 GWp could imply higher costs, but we believe further analyses with other generation mixes should be carried out.
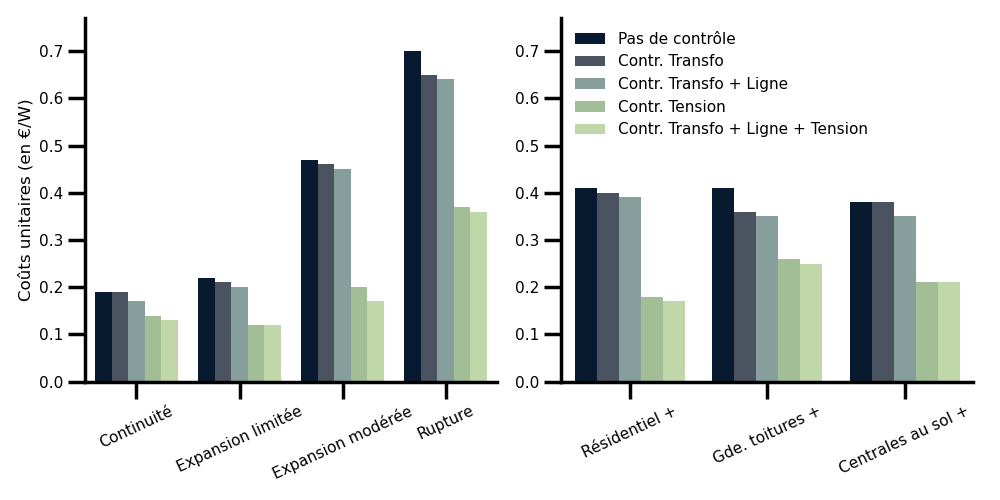
Figure 1 – Unit costs obtained for the different scenarios, with and without flexibility
Background and context
The growth of PV often creates a need to reinforce electricity grids. We carried out a study at the PERSEE laboratory focusing specifically on PV installations connected to the distribution grid (as opposed to the transmission grid) and on the reinforcement needs of that grid.
The costs associated with these grid reinforcements are extremely high in scenarios with strong PV growth: according to Enedis, in the “rupture” scenario of RTE’s “Futurs Énergétiques 2050” study, €6–8 bn/year would be needed for the connection of new PV installations to the grid operated by Enedis alone. By way of comparison, Enedis currently invests about €4 bn/year in total (all needs combined) in modernising, maintaining and developing the electricity distribution grid it operates in France. Keeping the distribution grid investments required by PV growth under control is therefore a major issue.
The flexibility of photovoltaic generation is frequently put forward as a way to limit or defer these investments in distribution infrastructure when large volumes of PV generation are connected. The benefits this solution may deliver have already been demonstrated in various ways: simulation studies, demonstrators, and real-world deployments (see the CRE report “évaluation de la performance des gestionnaires de réseaux sur le développement d’un réseau électrique intelligent”). There is, however, too little objective evidence today — based on an open methodology and with results that can be extrapolated to the national scale — to answer the following questions: would it make sense, in France and over the next two decades, to make massive use of PV generation flexibility (at medium and low voltage) to limit or defer investments in the electricity distribution grid? Quantitatively, what costs and benefits would such a change bring? What share of the €6–8 bn/year of investment estimated by Enedis in the “rupture” scenario, in particular, could be avoided?
In the absence of such evidence, uncertainty dominates, no consensus emerges between the various stakeholders (generators, concession-granting local authorities, grid operators, the national regulator, government departments, etc.), and PV generation flexibility remains virtually unused in France (3 connection offers issued and accepted by Enedis in 2022, see the CRE report, and no use of flexibility at all to avoid constraints in low-voltage grids).
The work carried out at the PERSEE centre aimed to assess the techno-economic relevance of this solution at the scale of France, and over the same time horizon as the RTE scenarios (2050), so as to help dispel the uncertainties that hamper decision-making about the role to give to PV generation flexibility in the French electricity distribution grid.
Methodology
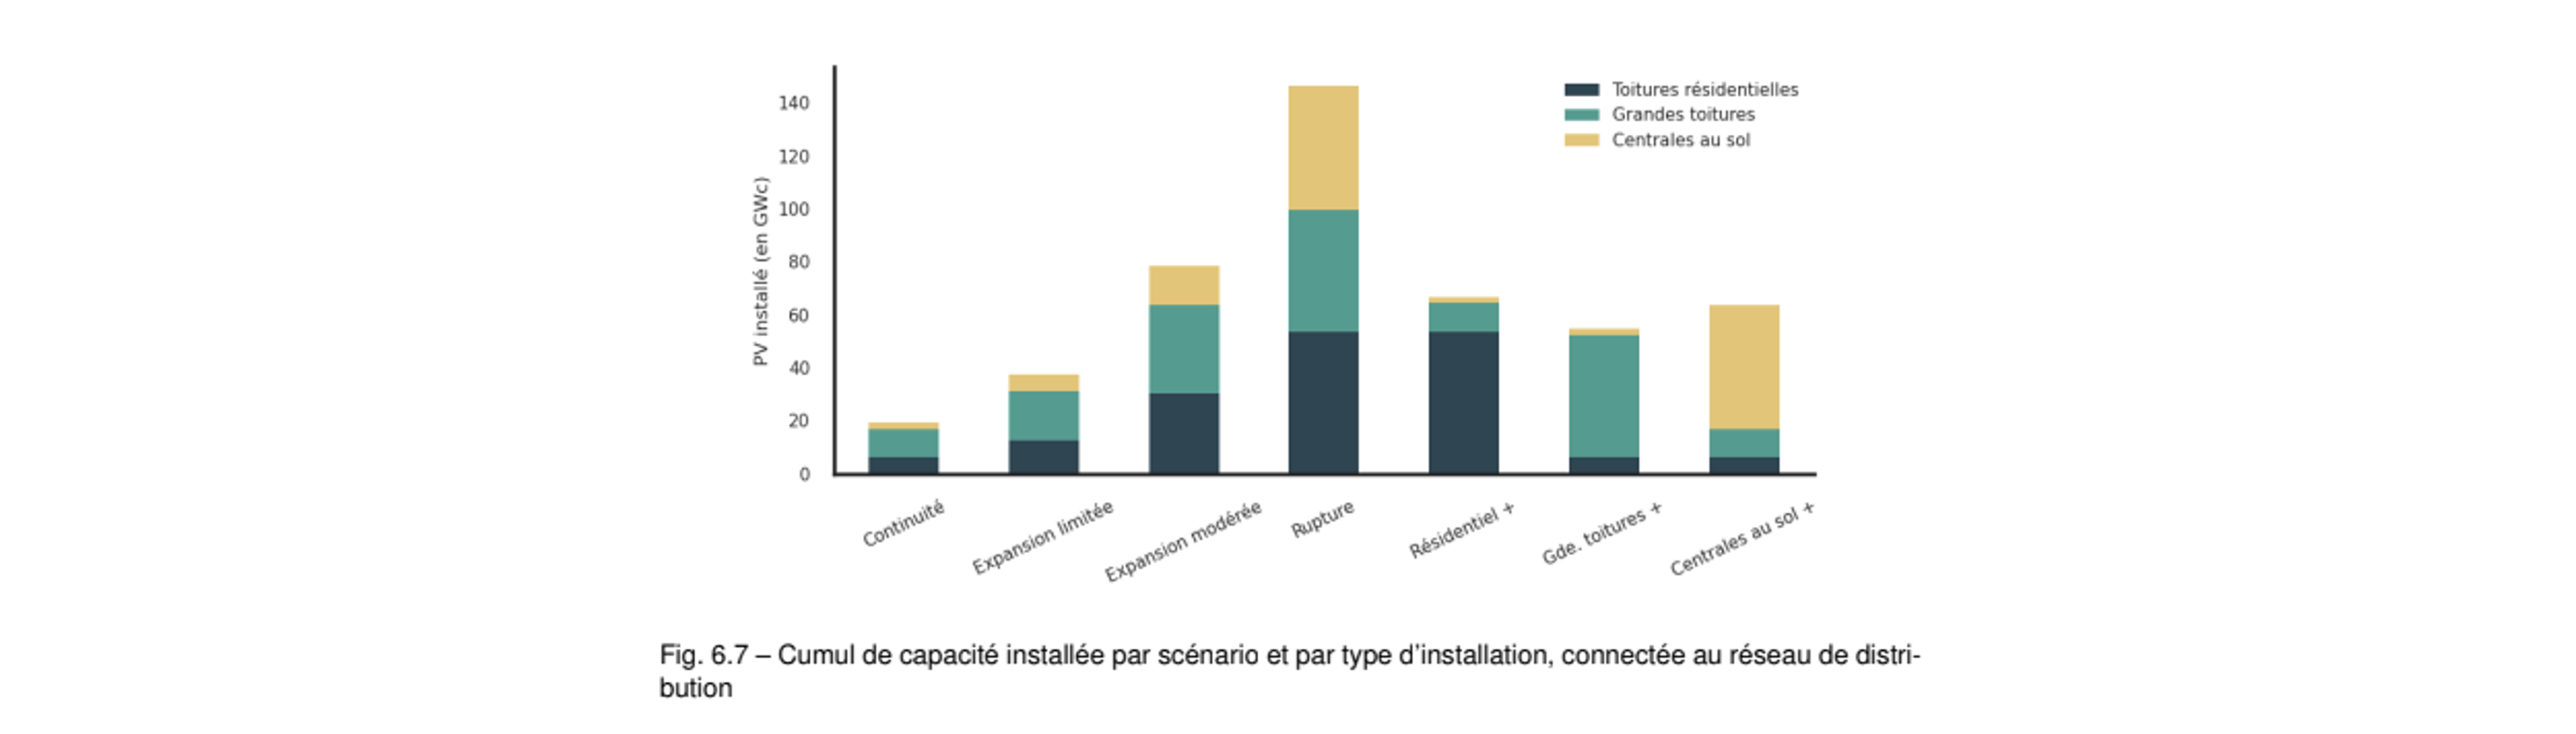
We define detailed PV deployment scenarios based on a bottom-up approach that accounts for implementation constraints (available rooftops and land). Two sets of scenarios are selected: one that makes it possible to assess the impact of the penetration levels considered by RTE in the “Futurs énergétiques 2050” study, and one that measures the sensitivity to the type of plant deployed (residential rooftops, industrial rooftops and ground-mounted plants).
We simulate, year after year, the impact of this deployment on the electricity distribution grid, with and without recourse to flexibility, and detect the appearance of voltage constraints, line current constraints and power constraints in MV/LV transformers. Where needed, the grid is progressively reinforced until the constraints disappear. When PV generation flexibility is used, the injection of a generating installation is never limited below 70% of its rated power.
We compare costs with and without flexibility. Without flexibility, only investment costs are evaluated, using a unit-cost model that depends on the operation to be carried out, the voltage level and whether the area served is urban or rural. With flexibility, we additionally value the energy not injected by the generating installations, by modelling the power flows in the grid hour by hour for each year of the simulation.
Main results that are not directly related to flexibility
With or without flexibility, the depth of the project pipeline available to reach a given total target capacity considerably influences the amount to be invested in the grid: average unit connection costs (€/W) are indeed extremely different depending on whether a large pipeline of PV projects is available — so that the target capacity is reached by building only those projects for which grid connection is favourable — or whether no such pipeline exists and all available PV projects must be built to reach the target, including those for which grid connection is unfavourable. For the “rupture” scenario, for example, giving up 15% of the PV potential (17 GW) would save 49% of reinforcement costs (a total cost of €42 bn for 99 GW, i.e. €0.42/W instead of €0.70/W when connecting all 116 GW of the “rupture” scenario), while giving up 34% (39 GW) of the PV potential would save 79% of the costs (a total cost of €17 bn for 77 GW, i.e. €0.22/W). The existence of a large pipeline of PV projects, well in excess of the target capacity, is therefore crucial to limiting grid investment costs.
In every case (with or without flexibility, and whether or not a large PV project pipeline is available), unit grid reinforcement costs (i.e. in €/W) rise sharply in scenarios 3 (“moderate expansion”) and 4 (“rupture”) compared with scenarios 1 (“continuity”) and 2 (“limited expansion”).
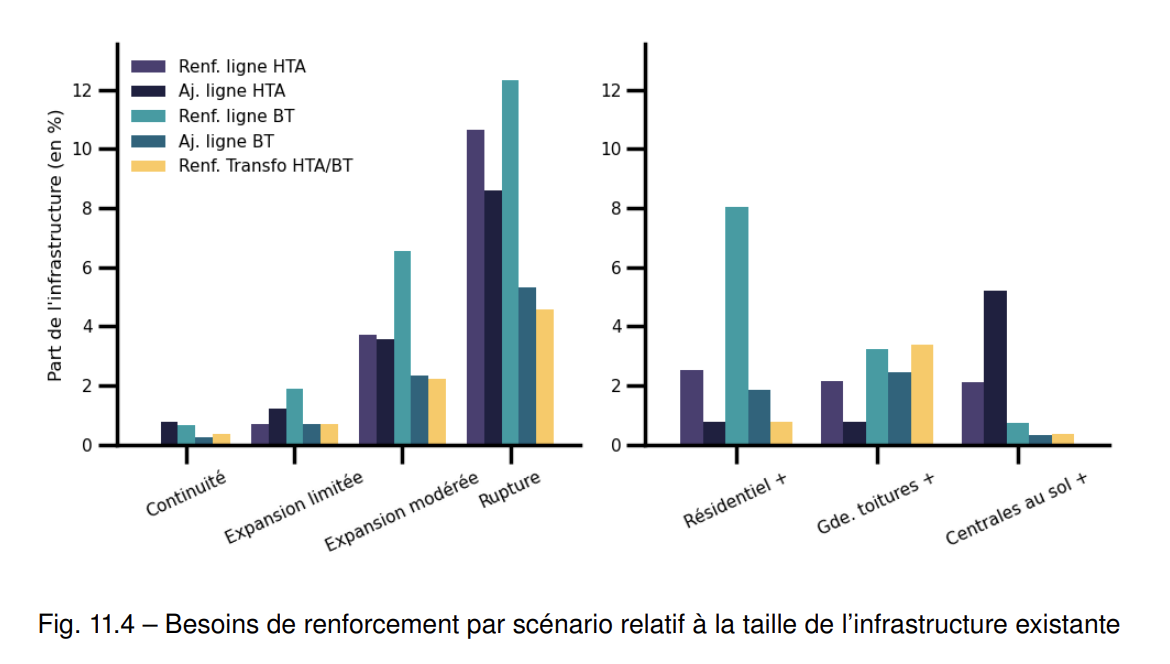
The type of generating installation (residential, large rooftop or ground-mounted plant) strongly influences the nature of the reinforcements required: a major impact on the LV grid for scenarios with strong growth of residential PV; a major impact on MV/LV substations for scenarios with strong growth of large-rooftop PV; and a major impact on the MV grid for scenarios with strong growth of ground-mounted plants. Remarkably, however, for the connected PV capacity of around 50 GW at which this comparison was made, the total costs obtained are fairly close for these very different reinforcement trajectories. At equal capacity, grid investment costs depend little on the mix of photovoltaic installation types (residential, large rooftop or ground-mounted plant).
Main results on the specific question of flexibility
Generation flexibility delivers substantial investment savings in every case studied, that is, whatever the deployment scenario considered, and whether or not a large PV project pipeline is available. As an order of magnitude, flexibility reduces reinforcement costs by at least 30% and sometimes by more than 60%, at the price of curtailing about 1% of PV output.
In scenarios with strong growth of photovoltaic capacity, the orders of magnitude of the gains are considerable; generation flexibility allows, for example, a reinforcement saving of about €11 bn (€6 bn instead of €17 bn, i.e. a 65% cost reduction) in the “rupture” scenario, assuming a project pipeline large enough that only those with a connection cost below €0.8/W are built. This assumption sets aside 39 GW (33%) of the 116 GW of PV capacity that would be connected in total, in the “rupture” scenario, if no upper limit were placed on unit connection cost.
Voltage constraints (as opposed to current constraints), at both medium and low voltage, account for the very large majority of the reasons for reinforcing or building infrastructure. Yet voltage constraints are precisely those for which flexibility is easiest to implement operationally, through simple local control of the inverter. It is therefore possible to capture most of the value of photovoltaic generation flexibility without, a priori, much implementation difficulty.
In every scenario studied, flexibility brings net benefits, i.e. the avoided grid investments are worth more than the energy not injected. These net benefits increase sharply with the level of PV penetration.
Deploying flexibility is particularly favourable for residential rooftop installations (as opposed to large rooftops and ground-mounted plants). This is due both to larger avoided investments (€13 bn for the “residential” scenario against €7.8 bn for the “ground-mounted” scenario, both targeting the same capacity of about 50 GW) and to less curtailed energy (0.39% against 1.53%), thanks to the closer proximity to consumption. The final report describing the methodology and the full set of results is available here.