Summary – Pumped-storage hydropower (PSH) stores electricity by pumping water from one reservoir up to another, then running it back through a turbine when it is needed. In Europe, the best large sites are already equipped; what remains are the small ones: a lake and a natural depression, or two depressions, a few kilometres apart, with a few tens of metres of height difference. With Antoine Rogeau (Mines Paris) and Emanuele Quaranta (Joint Research Centre of the European Commission), we have just published in Applied Energy, in open access, the first European inventory of these small pumped-storage sites [1]. Across 37 countries, our method retains 21,115 sites, which together would store 0.40 TWh, of which 0.24 TWh in the European Union: roughly half of the actually usable storage of the Union’s large pumped-storage plants. I explain here how these sites are found on a map, why dry depressions sitting on limestone should be treated with suspicion — this is karst, these limestone plateaus riddled with holes like Swiss cheese —, and why the total depends above all on two choices: the distance allowed between the reservoirs and how karst is treated. It is a real resource, but an expensive one and often far from consumers, which field studies can only reduce: a tool for knowing where to look, not a promise.
Storing electricity by pumping water uphill
A pumped-storage plant is a battery made of two reservoirs and a height difference. A pumped-storage plant links two reservoirs located at different altitudes. When electricity is abundant, a pump lifts water from the lower reservoir to the upper reservoir; when it is needed, the water is let back down through a turbine, which is often the same machine running in the opposite direction. Not everything is recovered: across the European Union’s fleet, about 70% of the electricity consumed for pumping comes back to the grid [2].
It is the dominant form of long-duration electricity storage. Pumped storage exceeded 200 GW worldwide at the end of 2025, even though batteries are growing very fast. France has six large plants, for about 5 GW, including Grand’Maison, in Isère, the most powerful (about 1,800 MW in generating mode), and Montézic, in Aveyron, which we will come back to in connection with karst [3].
If it is back in the conversation, it is because solar and wind require flexibility. A power system that relies more and more on variable generation must be able to shift energy in time, and the European Commission’s Joint Research Centre (JRC) estimates that the Union’s flexibility needs will be multiplied several times over by 2050 [4]. A pumped-storage plant does exactly that on a daily scale: it pumps the midday solar surplus and gives it back in the evening. In France, they were developed so that we could pump at night and let our nuclear power plants run at full output.
But the best large sites are already equipped. The European Union’s pumped-storage fleet is often credited with 1.3 TWh of storage, but what is actually usable would rather be 0.5 to 0.6 TWh, and recent assessments converge: the most favourable sites are already in use, and the best expansion options consist of making better use of existing reservoirs rather than building large new ones [2]. Hence the search for “alternative” resources: pairs of existing reservoirs, closed loops built away from rivers, disused mines, agricultural reservoirs. This is the family our work belongs to.
What if we went small?
Small pumped storage is the same principle, at the scale of a pond. By this we mean a closed-loop pumped-storage plant — the water goes back and forth between two reservoirs — in which each reservoir covers at most 1 km², i.e. 100 hectares [5]. Each of the two reservoirs is either a lake that already exists or a natural depression in the terrain that would be made watertight in order to fill it. In our reference scenario, a site stores 5 to 100 MWh. Emptied in eight hours, that makes 0.6 to 12.5 MW, and 1.3 MW for the median site, whereas a large pumped-storage plant has hundreds.
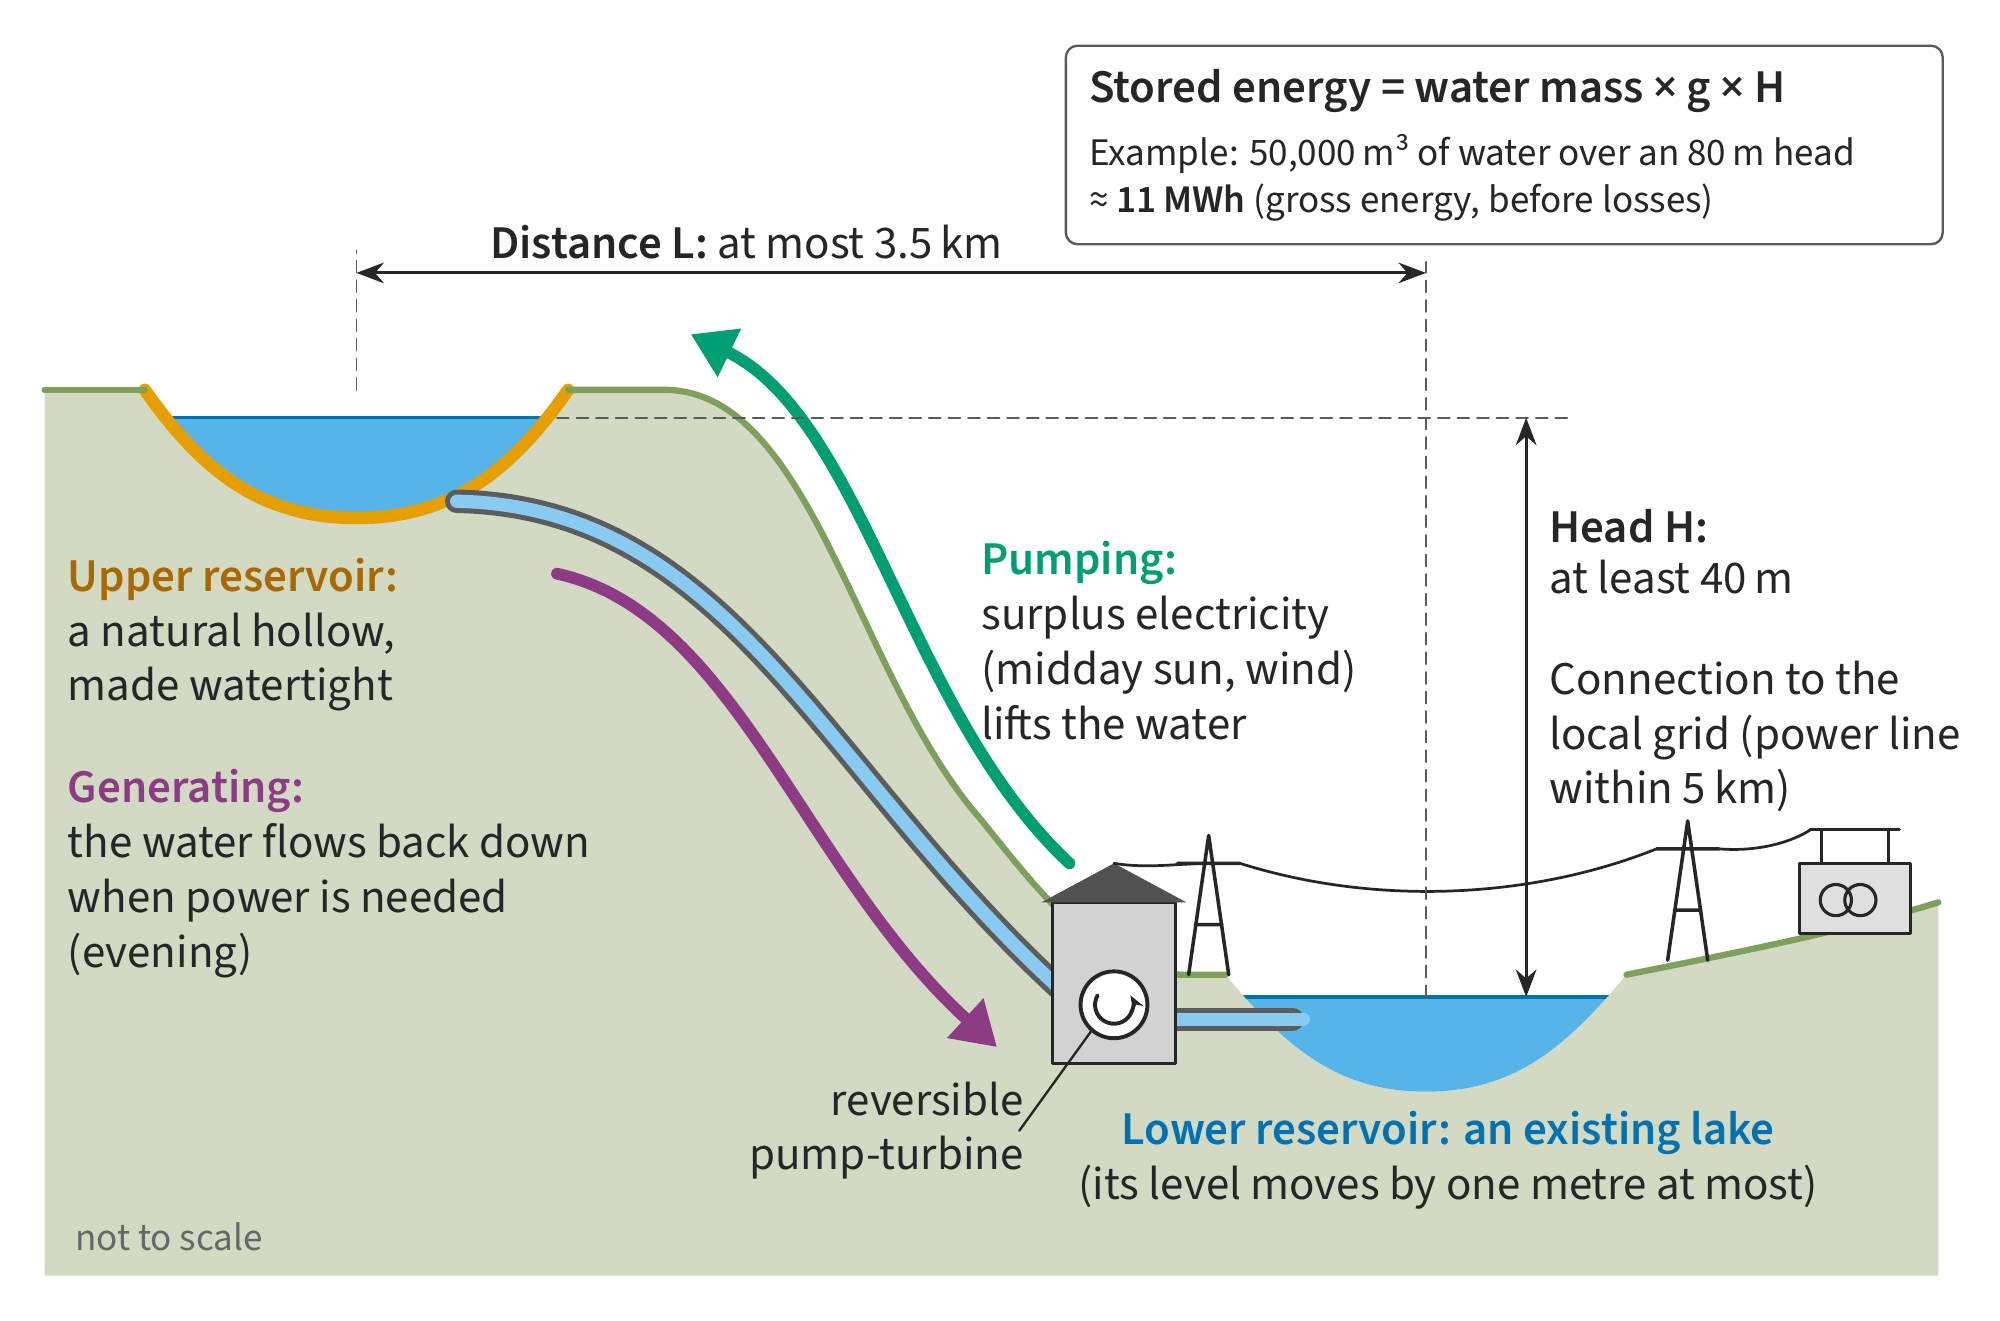
Figure 1 – The principle of small pumped storage. When electricity is abundant, the machine pumps water from the lower reservoir to the upper reservoir; when it is needed, the same machine turbines the water flowing back down. Here the lower reservoir is an existing lake, whose level is varied by only one metre, and the upper reservoir is a natural depression made watertight. The thresholds are those of our reference scenario: at least 40 m of head, at most 3.5 km between the reservoirs, a power line less than 5 km away.
An order of magnitude, to fix ideas. The stored energy is that of the water that has been lifted: its mass, multiplied by gravity and by the head. It is not much: a cubic metre falling 82 m, the median head of our sites, provides only 0.22 kWh, so nearly 4,500 m³ are needed per megawatt-hour. A site of 11 MWh, the median energy of our sites, thus requires about 50,000 m³ of water going back and forth: a 5-hectare pond one metre deep [6].
Nobody had estimated its potential at the European scale. The major atlases rule these sites out by construction. The Australian National University’s global atlas of closed-loop pumped storage only keeps reservoirs of more than one million cubic metres and sites of 2 to 150 GWh, and it begins by “filling” the terrain before searching, which erases precisely the depressions we are looking for; the European assessment of pairs of existing reservoirs only keeps reservoirs of more than 100,000 m³ and heads of more than 150 m [7]. The only small-scale continental inventory, in Australia, pairs agricultural reservoirs less than 500 m apart: 30,295 sites for 3.3 GWh, a resource of a different nature, complementary to ours. Our method is the one we developed in 2017 for France with Antoine Rogeau and Georges Kariniotakis [8], extended here to 37 countries and revised on several points.
How we search: pouring water on a map
It all starts from a digital elevation model (DEM). It is a map of ground altitudes, here on a grid of 30 m cells for the whole of Europe, and 10 m in Norway and Sweden, where we used the national lidar surveys. The algorithm “fills” it the way one would pour water over a relief model: wherever the water would stay without overflowing, there is a closed depression. We keep those between 2,500 m² and 1 km² and more than one metre deep. Existing lakes come from the European land-cover map, CORINE Land Cover [9].
We then form pairs. An upper reservoir and a lower reservoir, less than 3.5 km apart, with at least 40 m of head and a power line less than 5 km away. An existing lake can only rise or fall by one metre — this is our reference assumption, which we vary from 0.5 to 5 m — and its usable volume is therefore its area multiplied by one metre. This is one of the changes compared with 2017, when we took a fixed fraction of the volume, including for natural lakes. A pair must store at least 5 MWh.
We remove what cannot host a reservoir. Strictly protected areas, built-up and industrial zones, upper reservoirs above 2,500 m altitude, where firn fields and glacial cirques distort the terrain, and depressions on karst, which I discuss below. Nature parks and Natura 2000 sites remain in the reference, but we measure separately what excluding them would cost.
Finally, we choose without counting the same reservoir twice. The same lake can appear in dozens of candidate pairs, but it can only be used once. Choosing the set of pairs that stores the most energy, with each reservoir used only once, is a classic problem of graph theory, “maximum-weight matching”; we solve it exactly, in a few seconds for the whole continent [10]. Of the 670,654 candidate pairs, the reference retains 21,115 sites. They fall into three broad families: those that use an existing lake, large dry depressions and small dry depressions (Figure 2).
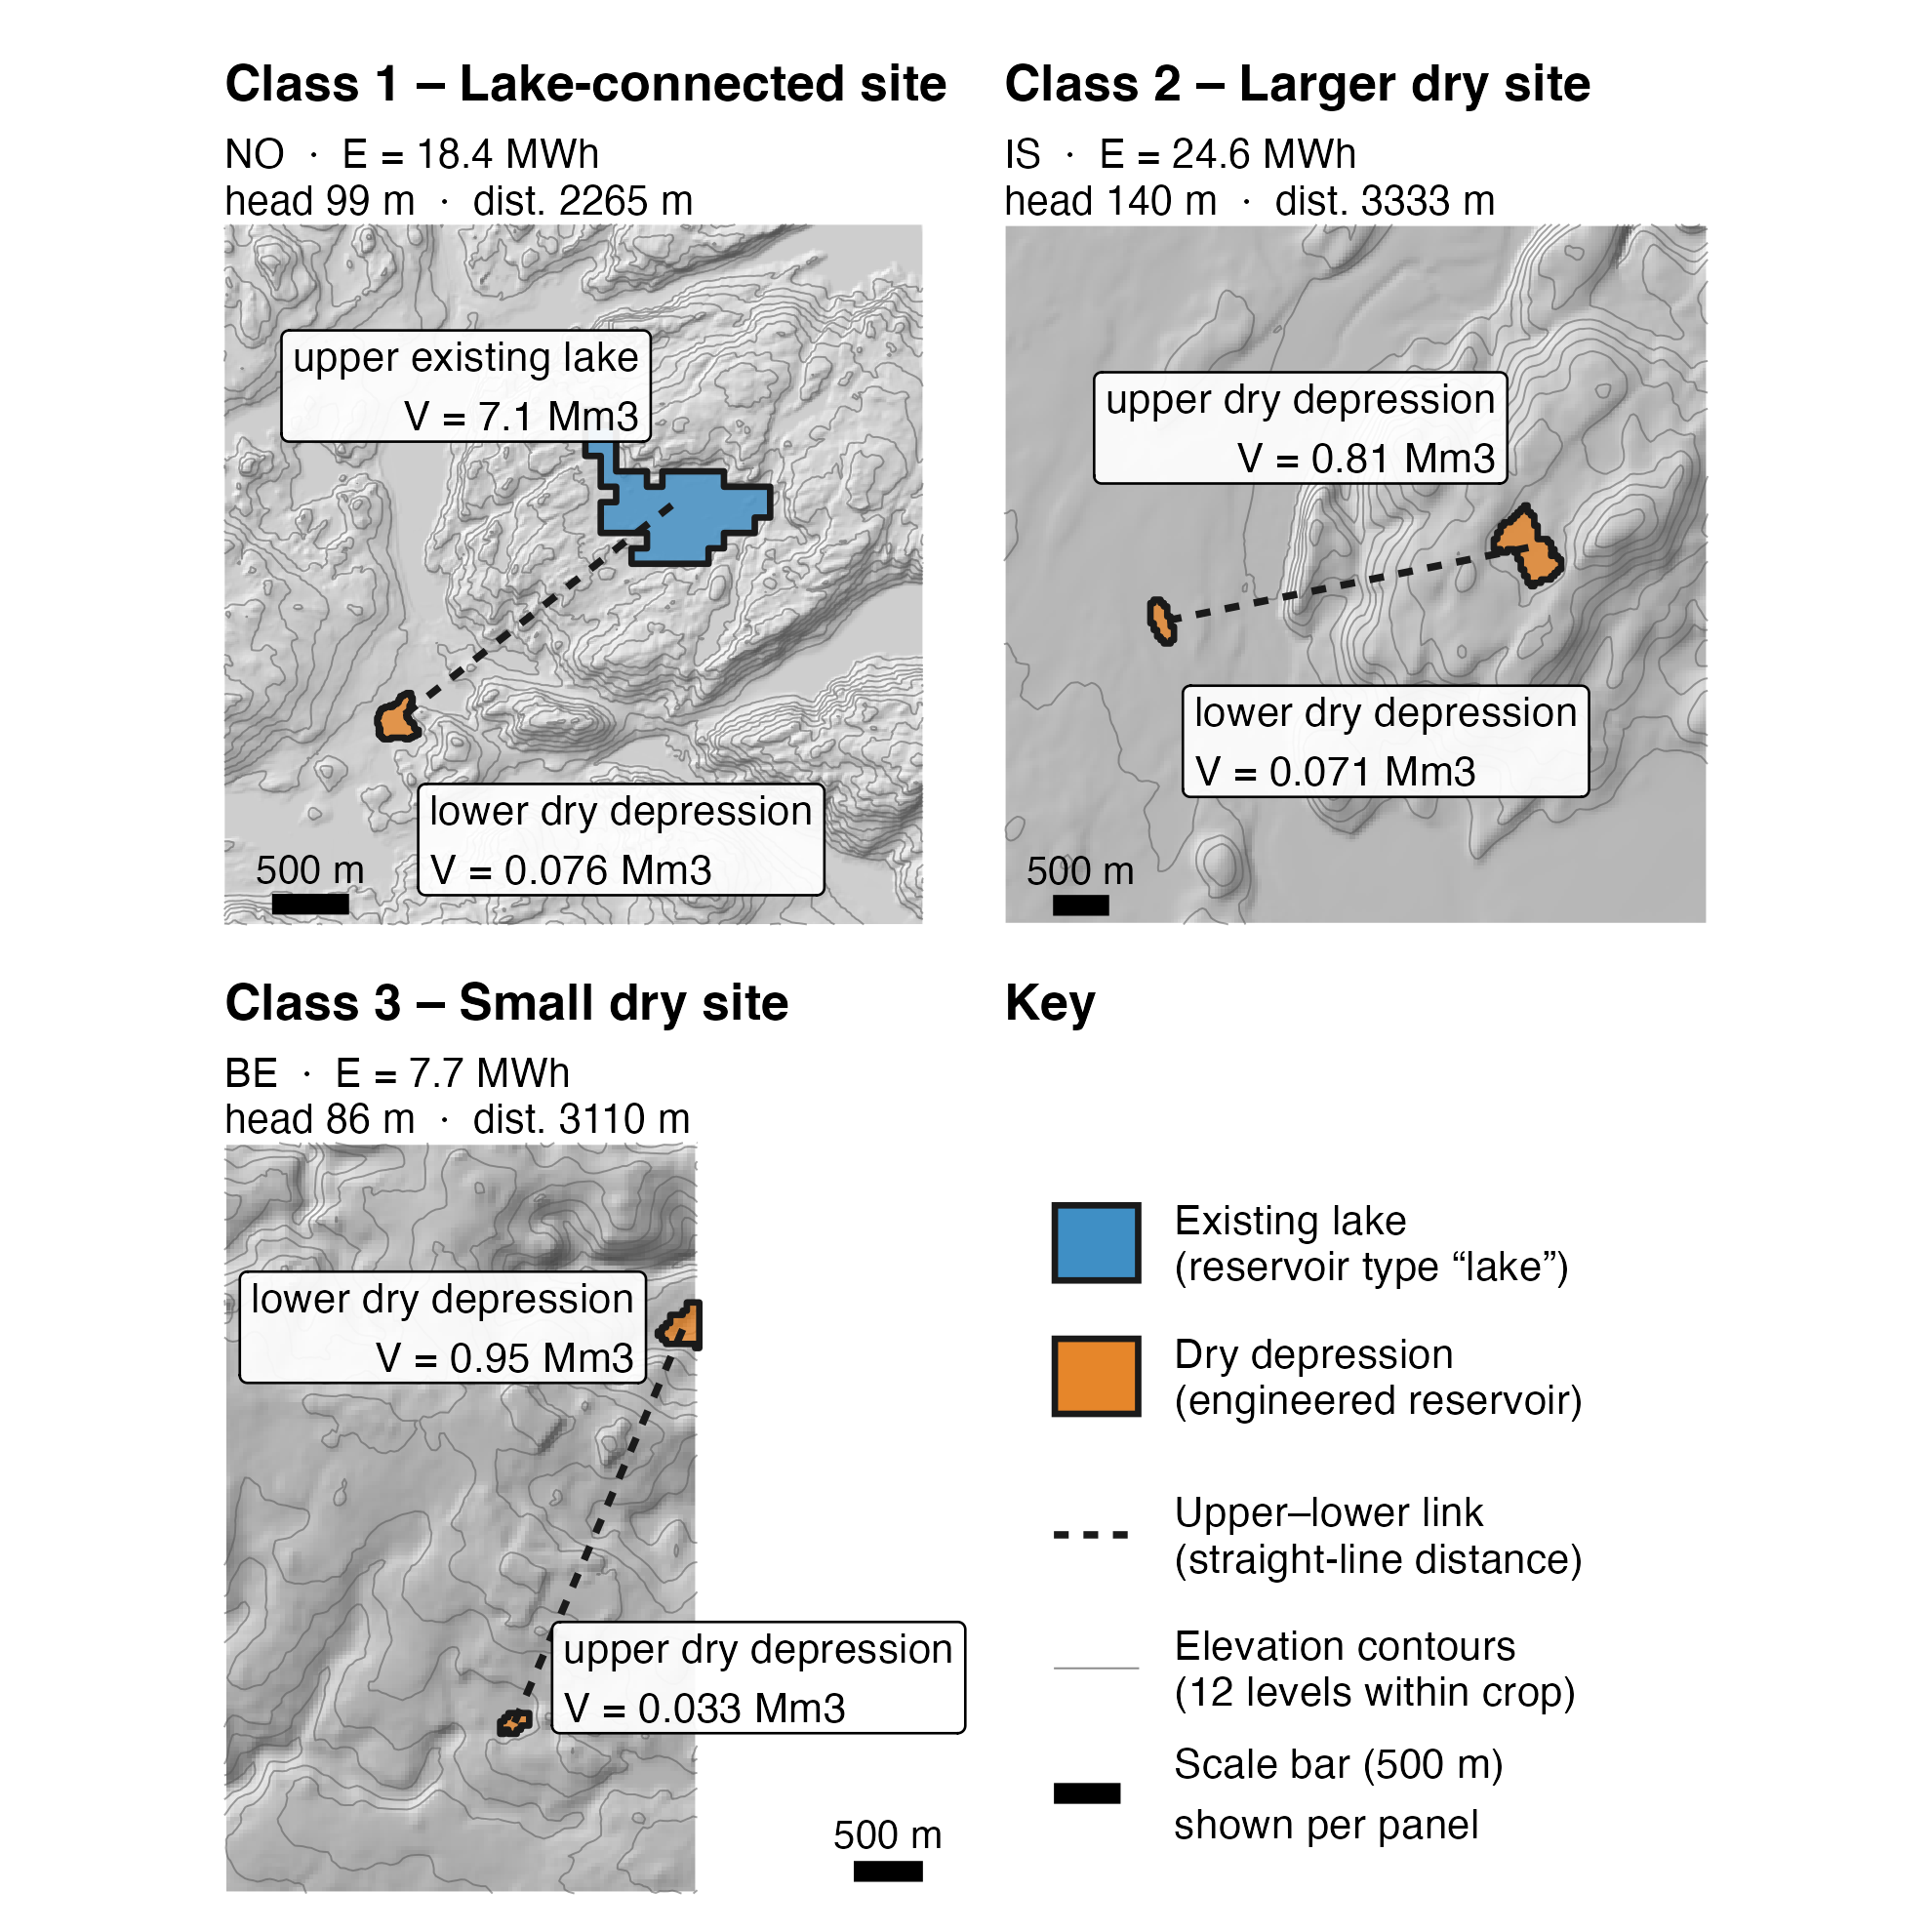
Figure 2 – Three real sites, the most representative of each of the three families in the reference: a site with an existing lake (3,559 sites, 109 GWh in total), a large dry depression (6,493 sites, 204 GWh) and a small dry depression (11,063 sites, 92 GWh). In blue, an existing lake; in orange, a depression to be developed; dashed, the straight-line link between the two reservoirs.
The most unexpected lesson came from the terrain data itself. A DEM that “sees” trees and buildings invents depressions: in France, the Copernicus surface model gives five times the resource obtained with the national lidar DEM of IGN (394 GWh versus 72). FABDEM, a version of the same model from which trees and buildings have been removed by machine learning, comes within 17% of the national reference (60 GWh against 72), and it is the one we retained for Europe. But that is not enough everywhere. In Norway, FABDEM’s typical vertical error, around 5 m, is several times larger than the one metre of depth that defines a depression: with the national lidar, half of the detected depressions disappear, along with two-thirds of their volume, and the Norwegian resource loses 72% (from 329 to 92 GWh). Sweden loses 72% too. The lakes, for their part, do not move: it is the dry depressions that vanish. To look for small depressions, the vertical accuracy of the DEM matters more than its resolution [11].
Karst, or why a dry depression is suspect
Karst is a landscape carved by water dissolving limestone. Rainwater, charged with carbon dioxide, is slightly acidic: it dissolves limestone and dolomite (gypsum, for its part, dissolves in pure water). Over the millennia, it widens fissures, digs vertical shafts, the avens, caves and underground rivers, then comes out lower down through springs, the resurgences. At the surface, away from the canyons, what remains are dry plateaus, without rivers, riddled with closed depressions: dolines, or sinkholes. The word comes from Karst, the German name of the Kras, a limestone plateau in Slovenia that extends into Italy above Trieste. In France, carbonate rocks crop out over about a third of the territory, and over nearly half if those covered by other formations are counted [12]: the Grands Causses, the Jura, the Vercors, the Causse de Gramat and its Padirac chasm, or the Fontaine de Vaucluse, the karst spring with the highest mean flow in France. On the Grands Causses, dolines have an Occitan name, sotchs, and their clay floor, the best soil on the plateau, is often cultivated (Figure 3).
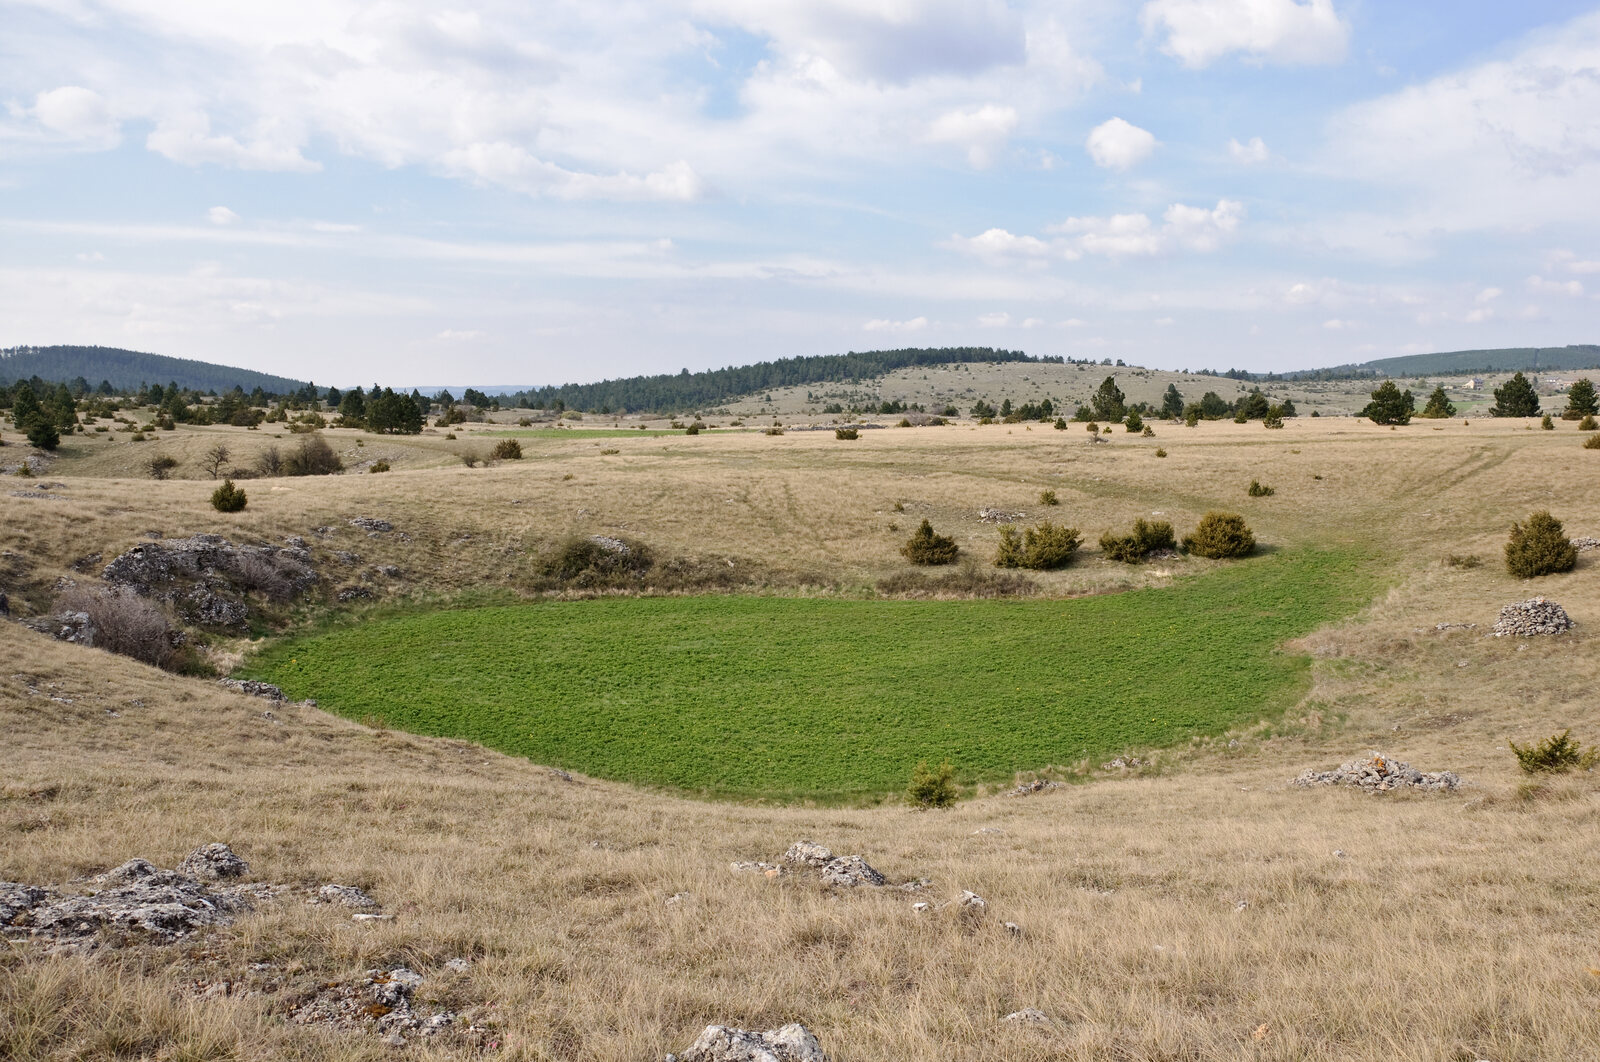
Figure 3 – A doline, or sotch, on the Causse de Sauveterre, in Lozère: a closed depression with a flat floor, lined with clay and cultivated, in the middle of a dry limestone plateau. This is the kind of depression our algorithm detects. Photo: Myrabella / Wikimedia Commons, licence CC BY-SA 3.0, resized.

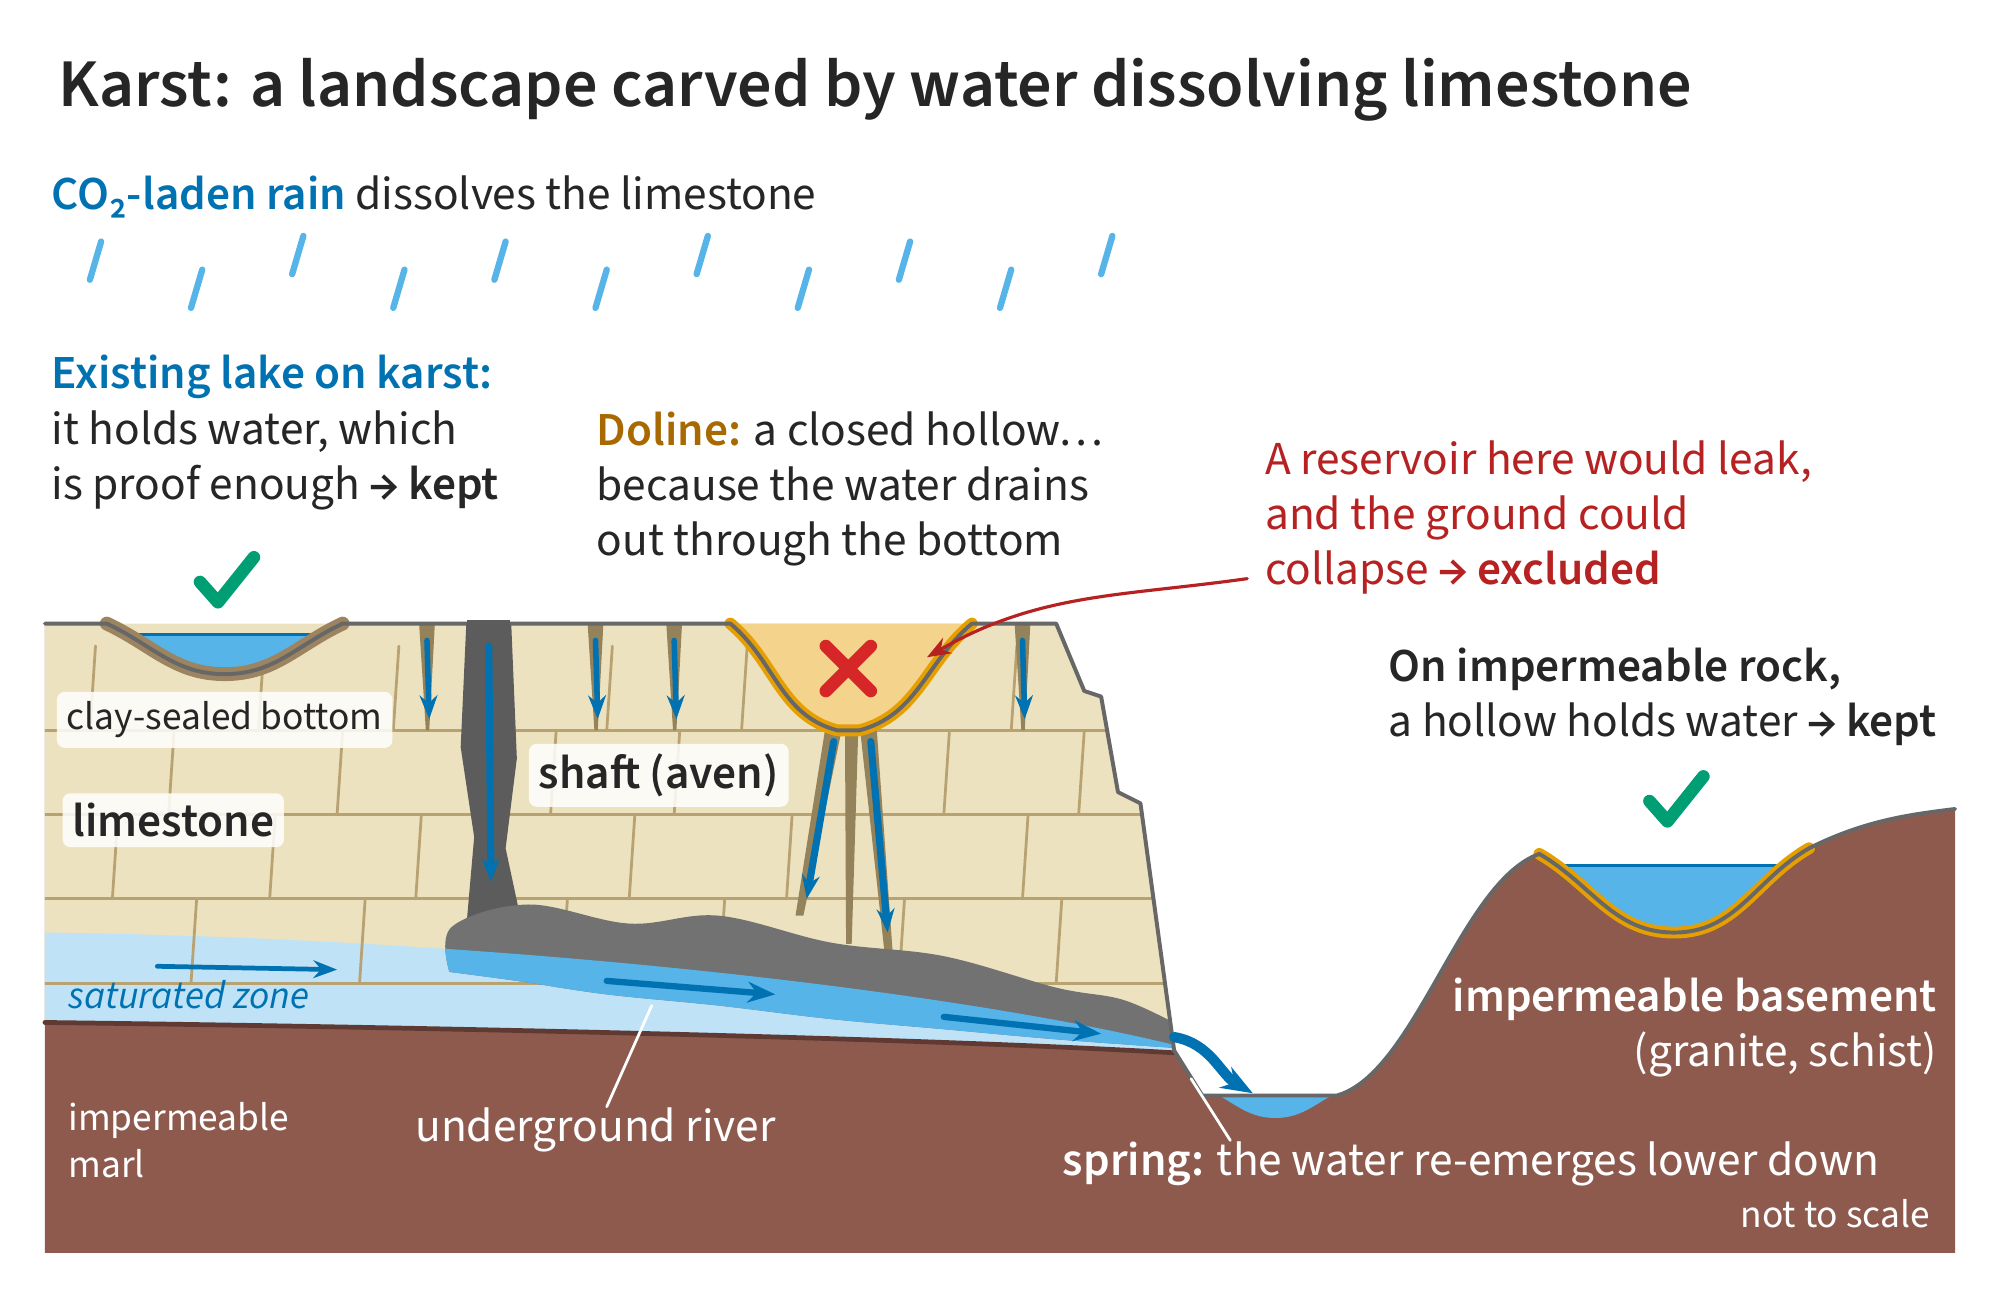
Figure 4 – Karst. Rainwater dissolves limestone, widens fissures and carves an underground network that comes out lower down, at a resurgence. At the surface, dolines are closed depressions because the water drains away through the bottom: a reservoir built there would leak. A lake that already exists on karst proves, on the contrary, that its bottom holds water, and a depression on impermeable rock retains it.
To our algorithm, a karst plateau looks like paradise. It looks for closed depressions, and karst is full of them. But a doline is closed precisely because the water drains away through the bottom: it is a funnel down to the water table. A reservoir built there would leak, and filling and then pressurising a mass of karstic limestone can cause collapses, subsidence, and even induced earthquakes [13].
Vajont is a reminder of what a misunderstood slope costs. On 9 October 1963 at 10:39 pm, in the Alps of north-eastern Italy, about 260 million m³ of Monte Toc slid into the reservoir of the Vajont dam, 262 m high. Some 50 million m³ of water overtopped the dam, which held, and razed Longarone, in the Piave valley: 1,917 dead according to the official toll, up to 2,500 according to other estimates. This was not leakage through karst, but a slope of limestone and clay layers dipping towards the valley, which the filling of the reservoir destabilised despite a first slide of about 800,000 m³ in 1960 (Figure 5) [13].
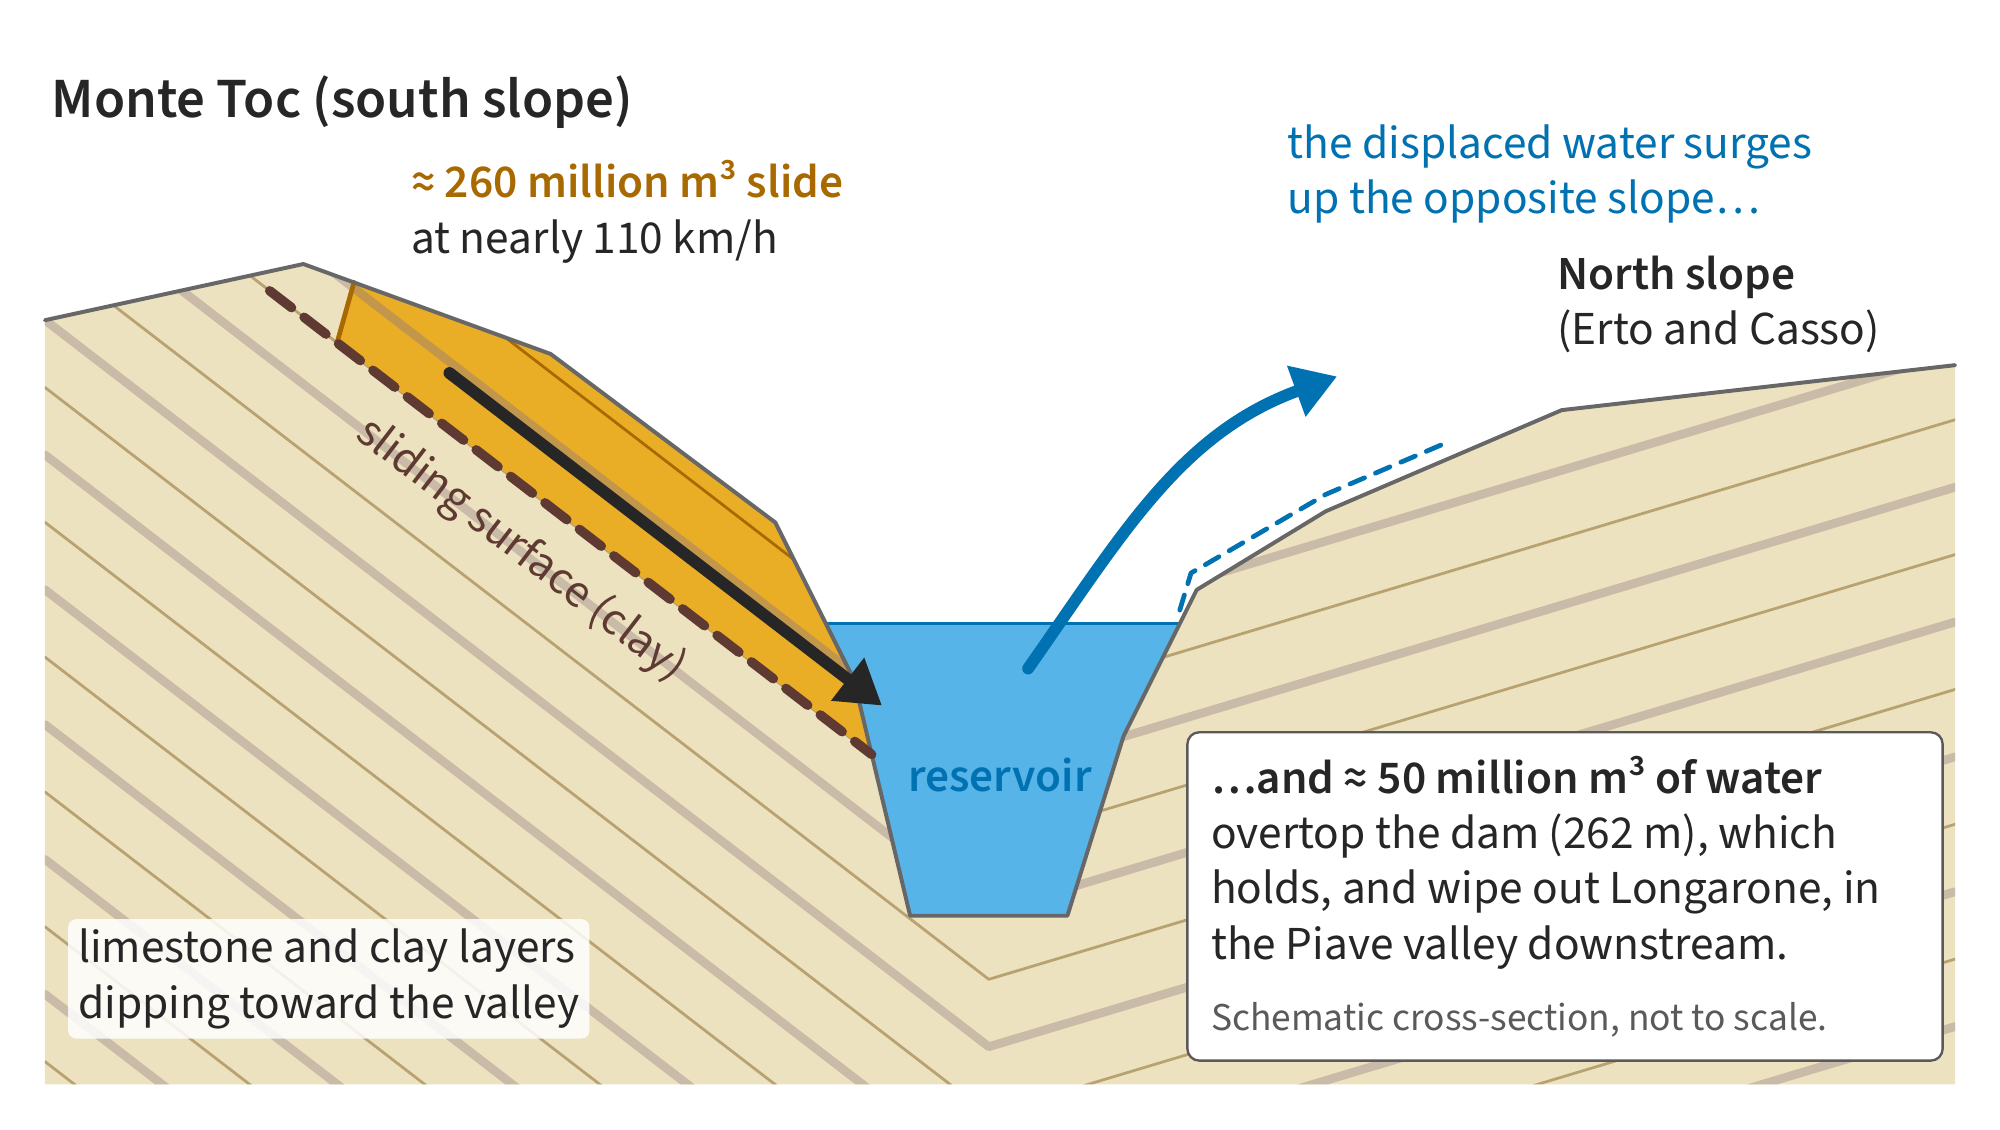
Figure 5 – The Vajont landslide, in a schematic cross-section through the gorge. The slope of Monte Toc slides along clay layers dipping towards the valley and drives the water out of the reservoir, which surges up the opposite slope and then passes over the dam, downstream. Diagram made for this post, not to scale.
Our rule: we exclude reservoirs to be built on karst, not the lakes already there. We use the European map of karst aquifers, WOKAM [12]. A pair is discarded as soon as the footprint of a reservoir that would have to be built touches mapped karst. An existing lake sitting on karst, however, is kept: if it holds water, its bottom is watertight, and the proof is there.
In 2017, our French study retained the Grands Causses. They were dolines. The Massif Central shows this clearly (Figure 6). In the south, almost all the detected depressions are on the limestone of the Grands Causses, and the karst filter removes about 94% of the region’s dry resource. What remains is in the north, on the impermeable crystalline basement, right where the Sarrans and Grandval dams and the Montézic pumped-storage plant, operated by EDF, are located. Our first study, without a karst filter, kept the depressions in the south [14].
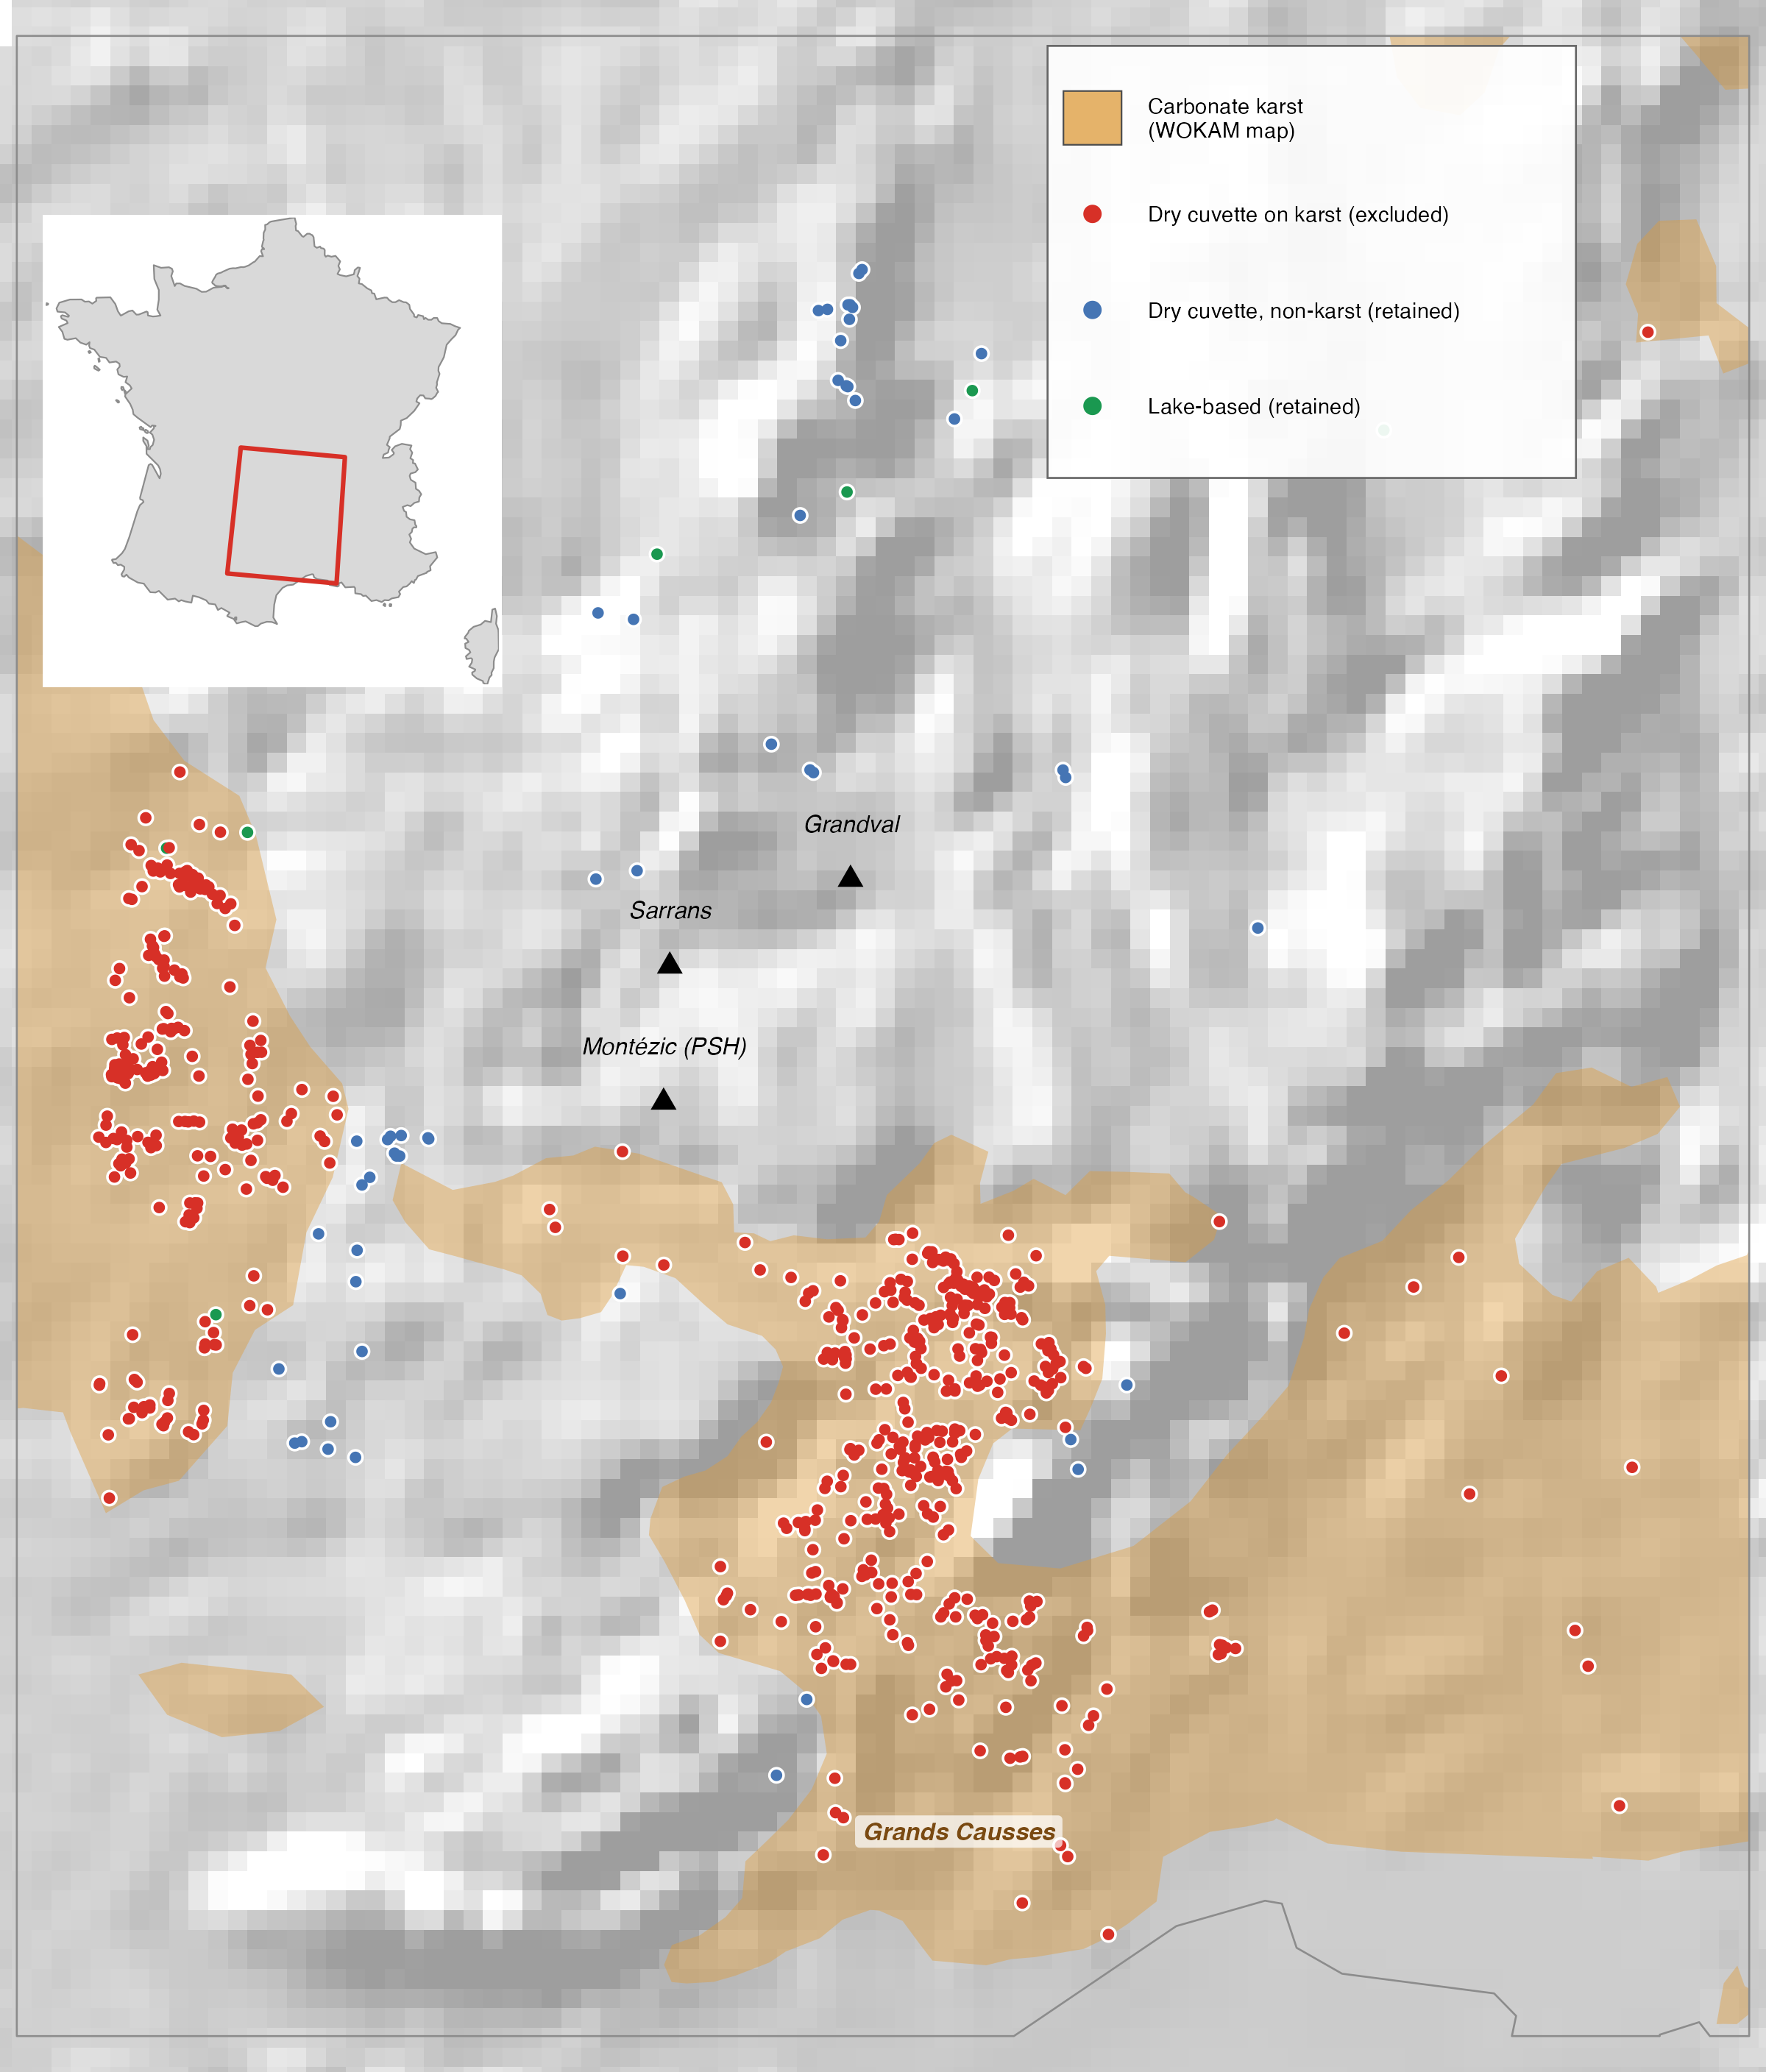
Figure 6 – The karst filter in the Massif Central. In red, the dry depressions sitting on karstic limestone (in ochre): they are excluded, and they are concentrated on the Grands Causses. In blue and green, the sites kept, on the impermeable basement of the north, like the existing hydropower plants of the region. Computed on French national data (see note 14).
Karst is not an absolute ban. Engineers know how to build reservoirs in karst, with grout curtains and the plugging of swallow holes, as at Buško Blato, in Bosnia and Herzegovina; other reservoirs have been losing their water ever since they were built, like the Boljunčica reservoir, in Croatia [13]. Our rule is a precautionary rule, not a verdict, and the total without karst is a lower bound. Accepting all karst would multiply the resource by 2.5 (1.02 TWh instead of 0.40) and would bring Montenegro, Bosnia and Herzegovina and Croatia into the leading group: this is Dinaric karst. Accepting karst depressions only when they adjoin an existing karst lake adds only 8%, because most of them are far from any lake. The real question, which we leave open, is therefore this one: do we know how to make small reservoirs on karst watertight, at an acceptable cost?
How much? It all depends on what you count
The broadest figure does not mean much. With one metre of drawdown on lakes and a power line less than 5 km away, the broadest selection retains 45,428 sites and 2.57 TWh, but it still contains karst and very large sites. Without depressions on karst or reservoirs above 2,500 m, 21,268 sites and 0.58 TWh remain. Capping each site at 100 MWh, to stay at the small scale we are interested in, gives our reference: 21,115 sites, 0.40 TWh, of which 14,160 sites and 0.24 TWh in the European Union (Figure 7).
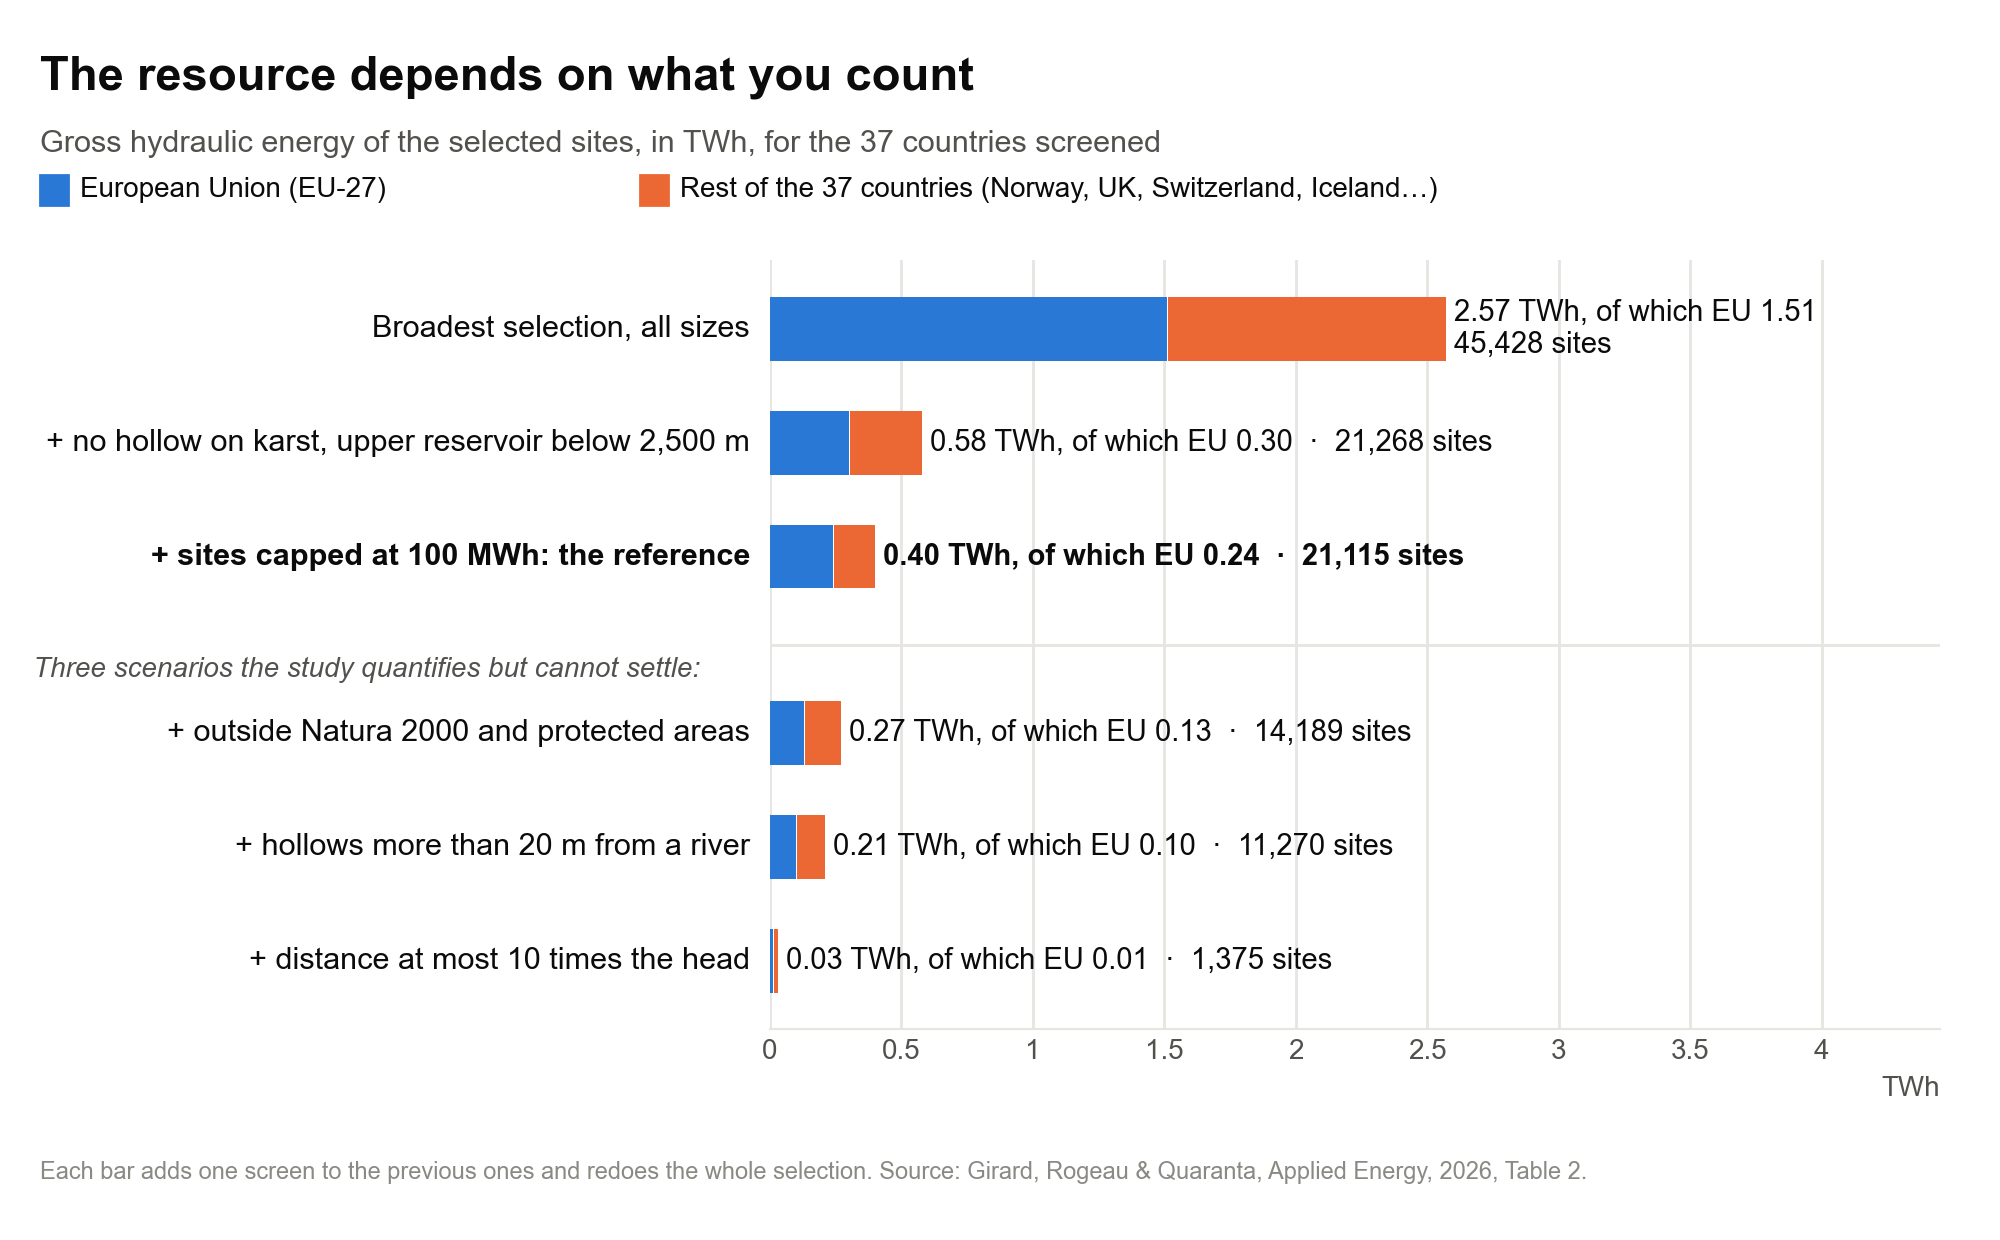
Figure 7 – The resource depending on what is counted, in TWh of gross hydraulic energy, for the 37 countries studied and for the European Union. Each bar adds a filter to the previous ones and redoes the whole selection: these are not subtractions. The last three bars are scenarios, not the reference.
Three other filters, which a continental study can quantify but not settle. Also excluding Natura 2000 sites and other protected areas, parks included, costs 30% of the energy, 40% in the European Union but only 9% in Norway, whose resource lies largely outside these zones. Discarding depressions less than 20 m from a river or canal — a depression crossed by a watercourse is not closed, and damming it would create a reservoir on the river — removes a further 64 GWh. The most severe filter is hydraulic: 86% of the reference energy lies in pairs whose distance exceeds ten times the head, that is, long penstocks for little height difference, costly and a source of losses. Keeping only the pairs where the distance is at most ten times the head leaves 2,811 sites and 73 GWh, less than a fifth of the reference [15].
To put these figures in context: a little under one hour of the Union’s consumption, but nearly half of its large pumped-storage plants. The European Union’s 0.24 TWh represent a little under one hour of its average electricity consumption. But that is roughly half of the actually usable storage of all its large pumped-storage plants, several times its fleet of grid-connected batteries in the middle of the decade, and of the same order as the resource of pairs of existing reservoirs, estimated at 141 GWh for the Union at comparable distances [16]. This storage would serve daily cycles or cycles of a few days, not getting through the winter.
Two choices weigh more than all the others: the distance between the reservoirs and karst. We varied eight parameters of the method together and redid the continental selection 40,000 times. The maximum distance between the reservoirs and the treatment of karst together explain most of the differences, far ahead of the distance to the grid and the site-size cap; the drawdown allowed on lakes and the altitude cap barely change the continental total, even though they matter site by site. Depending on the combination, the total ranges from less than one gigawatt-hour to more than 2 TWh. This is why we publish curves and scenarios rather than a single figure [17].
Where? In the north, and in the mountains
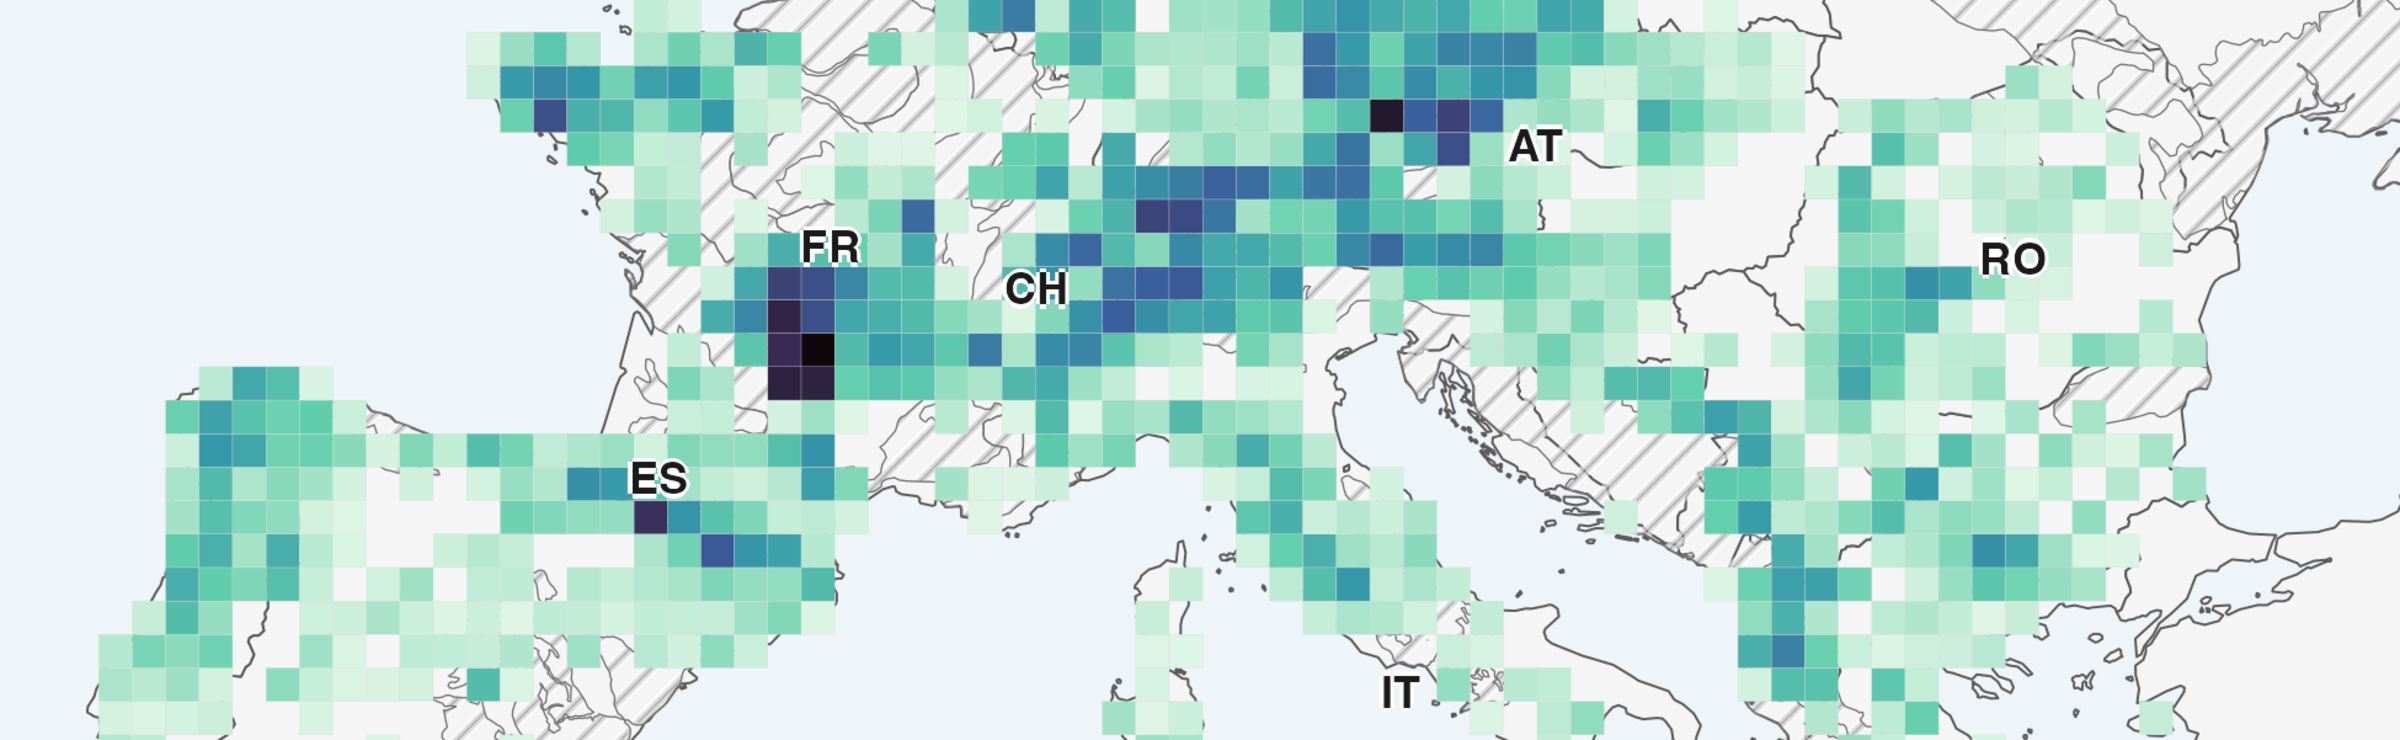
Norway comes first, France second. Norway holds 92 GWh, 23% of the total, ahead of France (60 GWh), Germany (34), the United Kingdom (29), Austria and Sweden (19 each). The resource extends over 165 regions in 35 countries, but it is concentrated in central and southern Norway and in Iceland, then along the Alps, the Pyrenees, the Carpathians and the Balkans (Figure 8). Germany’s 34 GWh, for their part, are scattered in small quantities over a multitude of hills.
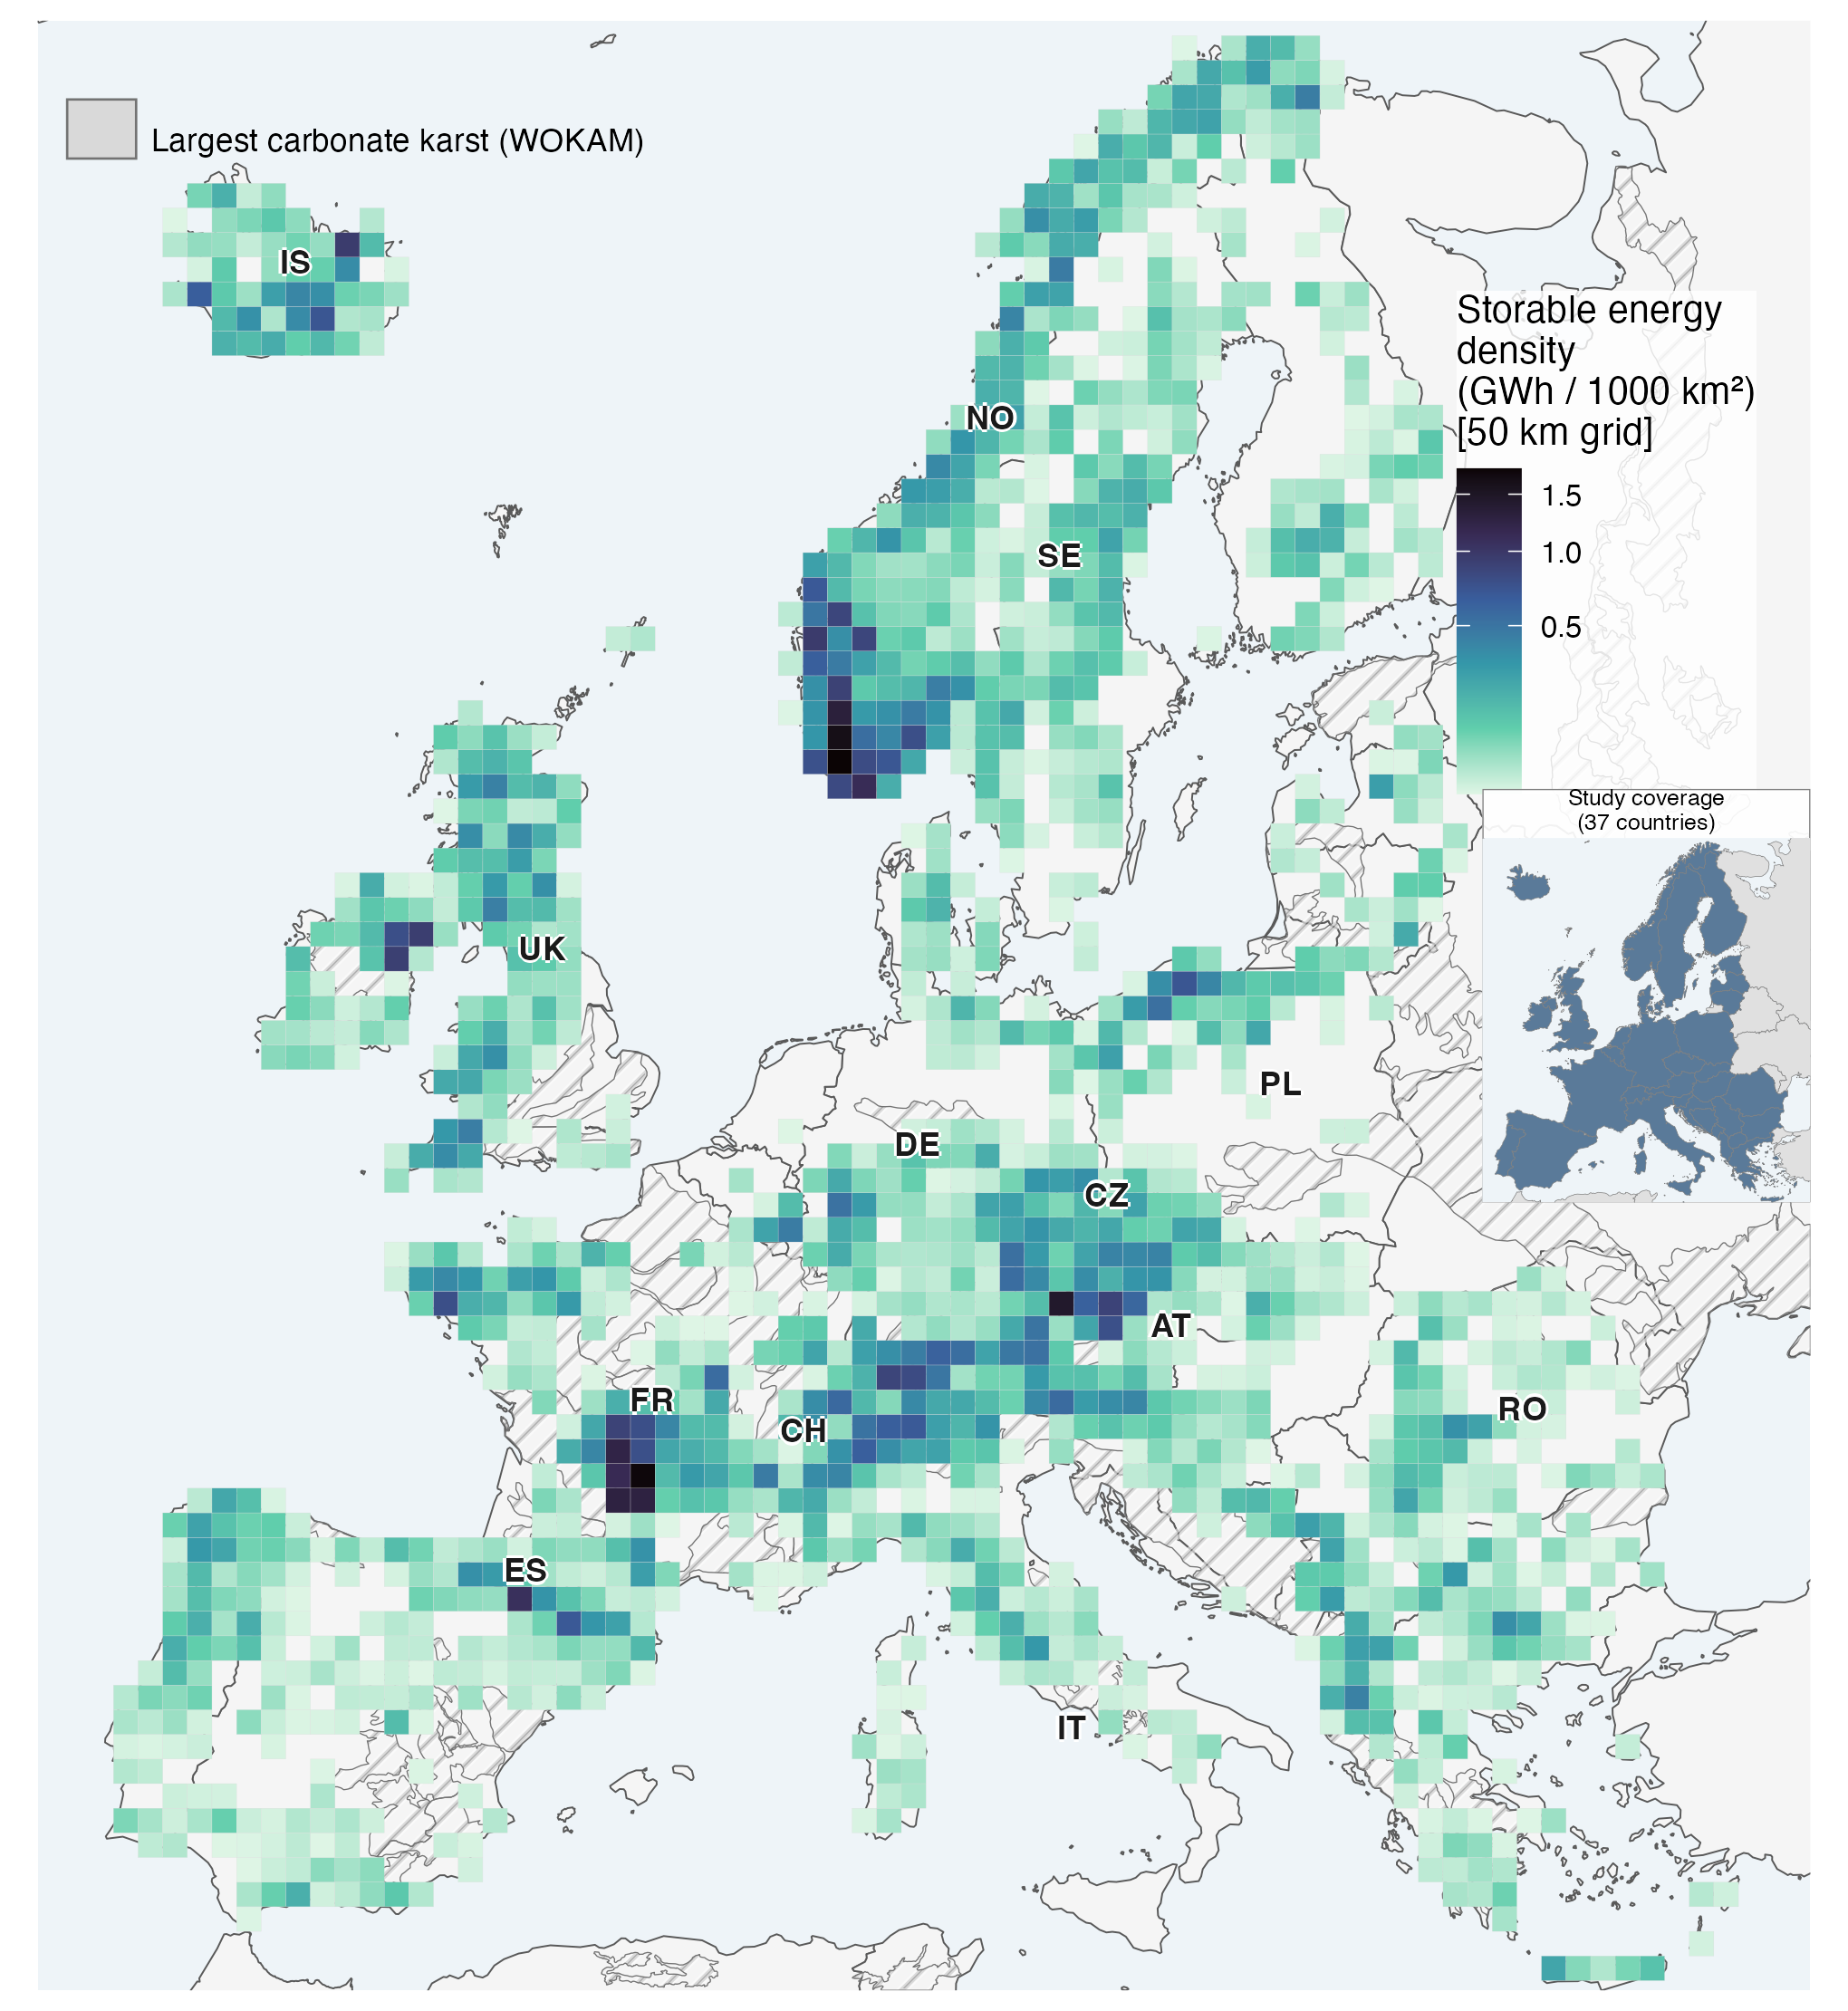
Figure 8 – The storable energy of the 21,115 reference sites, in GWh per 1,000 km², on a regular grid of 50 km cells (a grid avoids the biases of administrative units, which vary greatly in size). Hatching marks the large karstic limestone massifs, where dry depressions are excluded.
“Distributed” does not mean “close to consumers”. The sites are small and scattered, but far from large cities and from the existing fleet: the median site is about a hundred kilometres from the nearest existing pumped-storage plant, whereas existing plants are 29 km from one another, and only 11% are less than 25 km from a pumped-storage plant. They lie in regions that are less populated, windier and less sunny than those of the existing plants. Complementarity with regional wind power is plausible, but demonstrating it would require modelling the grid and its operation hour by hour, not overlaying maps.
In France, 3,849 sites and 60 GWh, almost all in dry depressions. Of these 60 GWh, 54 come from pairs of two depressions and only 5 from pairs with a lake — but the European lake map does not see small water bodies, and this lake resource is a lower bound. Two French features stand out: the grid is close (a substation 1.6 km away at the median), and more than half of the energy (54%) is in Natura 2000 or in a protected area. In France, the environmental question will weigh heavily [18].
At what cost?
It is an expensive resource. We added to the study a simple and transparent cost model, applied site by site, whose results are indicative [19]. The median site would cost about €1,150 per kilowatt-hour of storage for an eight-hour discharge (€1,620 for four hours), several times the published ranges for large European pumped-storage plants. The levelised cost of storage would range from €0.30 to €1.29 per kilowatt-hour delivered, depending on financing conditions.
It is not the reservoirs that cost, it is the pipes. This is counter-intuitive for a technology that consists of building reservoirs: for an eight-hour discharge, the penstock accounts for 44% of the direct investment and the machines 30%, the reservoirs 20% and the grid connection 5%. The units are small (1.3 MW at the median, versus hundreds of megawatts for large pumped-storage plants) and the head is low relative to the distance: at the median, the distance between the reservoirs is 32 times the head, which means kilometres of penstock for a few megawatts. Cheaper waterproofing membranes will not make these sites cheap. This breakdown is that of our model, which starts from natural depressions and counts only modest earthworks: where dykes or large excavations would be needed, the reservoirs would weigh more heavily, and the sites would cost even more [19].
What is robust is the ranking, not the amount. The two cheapest families, with a lake or with a large dry depression, cost about €830 to €840 per kilowatt-hour at the median, versus €1,420 for small dry depressions, and this gap withstands a 50% variation in each unit cost. The share of the resource below a cost threshold, on the other hand, varies by a factor of nine under the same assumptions: we do not give it.
And small machines are less efficient. At small scale, ordinary pumps running in reverse can be used as turbines, which is cheaper: a case study measured a round-trip efficiency of 42 to 50%, versus about 70% on average for the European fleet [20]. Our figures are gross energies, before these losses.
What this study is, and what it is not
A first screening, not an exploitable potential. Our work says where to look; it does not say what can be built. No site has been visited. We validated the method on France, where national and European data can be compared, on Norway, with the national lake inventory and the lidar DEM, and on Sweden, with its lidar DEM; the other 34 countries have not been cross-checked against national data.
Anything a field study adds can only reduce these figures. We will need to know the depth of the lakes and the drawdown they can accept, the actual route of the penstocks, the geotechnics of each footprint, the capacity of nearby substations to accommodate a few megawatts in both directions — a nearby substation does not mean the grid can absorb them —, the actual cost of each site and its value to the power system.
The data and code are open. The article is open access, the code is published, and the layers of candidate sites, country by country, are archived [1]. Anyone working on a given territory can look for its sites there.
What I take away from this. The European terrain does contain a resource of small pumped storage that the atlases ignored, of the same order as the resource of pairs of existing reservoirs that they had described. But it is neither a cheap resource nor one close to consumers, and its size depends above all on a geological question, karst, and a hydraulic question, distance. If small pumped storage has a future, it lies in the fraction of sites that combine a lake, a good head over a short distance, a nearby substation and ground that holds water, and it is precisely these sites that our inventory makes it possible to find.
Notes
[1] R. Girard, A. Rogeau, E. Quaranta, “Distributed small-reservoir pumped-storage hydropower in Europe: a GIS screening under drawdown and karst constraints”, Applied Energy, vol. 427, 129193, 2027 (online on 27 October 2026), open access under a CC BY 4.0 licence. The code (R and Snakemake, MIT licence) is on the project repository; the candidate-site layers by country, the selections and the scenario results are archived on Zenodo (CC BY-NC-SA 4.0 licence). All the figures in this post come from the article and its supplement, unless otherwise stated. They are gross hydraulic energies, without pumping or turbine efficiency.
[2] E. Quaranta, R. M. Boes, J. D. Hunt, S. Szabó, J. Tattini, A. Pistocchi, “Considerations on the existing capacity and future potential for energy storage in the European Union’s hydropower reservoirs and pumped-storage hydropower”, Journal of Energy Storage, vol. 104, 114431, 2024. The round-trip efficiency of 0.71 is the capacity-weighted average of the Union’s fleet. Comparisons with the existing fleet are indicative: its figures describe electricity that can be stored under the actual operating constraints of each plant, ours a gross hydraulic energy.
[3] World: 201 GW of pumped storage at the end of 2025, of which 11.7 GW commissioned during the year, according to the International Hydropower Association, 2026 World Hydropower Outlook, and its press release of 24 June 2026. France: six pumped-storage plants for 5 GW, according to French Senate report no. 498 (2025-2026) (in French), p. 140, which reproduces EDF’s list: Grand’Maison (1,790 MW), Montézic (910 MW), Super-Bissorte (730 MW), Revin (720 MW), Le Cheylas (460 MW) and La Coche (330 MW). Grand’Maison’s capacity is its generating capacity: only 8 of its 12 units can pump.
[4] D. Koolen, M. De Felice, S. Busch, Flexibility requirements and the role of storage in future European power systems, Publications Office of the European Union, JRC, 2023.
[5] There is no accepted boundary between “micro”, “mini” and “small” pumped storage: we therefore took a physical definition, reservoirs of at most 1 km² each, and we give the results by energy class (sites capped at 100 MWh, 500 MWh, 1 GWh, or uncapped). The reference caps each site at 100 MWh. For a four-hour discharge, capacities range from 1.3 to 25 MW (2.6 MW at the median). Under the European network code on requirements for grid connection of generators (Regulation (EU) 2016/631), a module of this size connected below 110 kV is type B in Continental Europe and Great Britain, type B or C in the Nordic area.
[6] The gross hydraulic energy of a pair is ρ g H V, with ρ = 1,000 kg/m³, g = 9.81 m/s², H the gross head and V the transferable volume, the smaller of the usable volumes of the two reservoirs: 1,000 × 9.81 × 82 J per m³, i.e. 0.22 kWh/m³ at 82 m. The median energy of the reference sites is 11.0 MWh and their median head 82 m; 11 MWh at 82 m corresponds to about 49,000 m³. These two medians are computed separately: the volume of the “median site” is only an order of magnitude.
[7] B. Lu, M. Stocks, A. Blakers, K. Anderson, “Geographic information system algorithms to locate prospective sites for pumped hydro energy storage”, Applied Energy, vol. 222, pp. 300-312, 2018; M. Stocks, R. Stocks, B. Lu, C. Cheng, A. Blakers, “Global Atlas of Closed-Loop Pumped Hydro Energy Storage”, Joule, vol. 5, pp. 270-284, 2021; M. Gimeno-Gutiérrez, R. Lacal-Arántegui, “Assessment of the European potential for pumped hydropower energy storage based on two existing reservoirs”, Renewable Energy, vol. 75, pp. 856-868, 2015; N. Gilmore et al., “Continental-scale assessment of micro-pumped hydro energy storage using agricultural reservoirs”, Applied Energy, vol. 349, 121715, 2023 (30,295 sites, 3.3 GWh, i.e. 0.11 MWh per site on average).
[8] A. Rogeau, R. Girard, G. Kariniotakis, “A generic GIS-based method for small Pumped Hydro Energy Storage (PHES) potential evaluation at large scale”, Applied Energy, vol. 197, pp. 241-253, 2017. Compared with this national study, the 2026 article changes scale (37 countries, with the cost of each data substitution measured on France, Norway and Sweden), adds three filters (explicit lake drawdown, karst, altitude cap), solves the selection exactly instead of with a heuristic, extends the sensitivity analysis to eight parameters and publishes the code and data.
[9] Terrain: FABDEM (L. Hawker et al., “A 30 m global map of elevation with forests and buildings removed”, Environmental Research Letters, vol. 17, 024016, 2022), except in Norway (Kartverket) and Sweden (Lantmäteriet), national lidar models resampled to 10 m. Depression detection by filling the DEM (O. Planchon, F. Darboux, Catena, vol. 46, 2002; R. Barnes et al., Earth Surface Dynamics, vol. 9, 2021): we keep depressions of 2,500 m² to 1 km², more than 1 m in maximum depth and more than 20 kWh per metre of head. Lakes: “water” class of CORINE Land Cover 2018 (European Environment Agency), whose volume is estimated by a topographic relationship. Exclusions: protected areas in IUCN categories Ia, Ib and IV (WDPA world database), CORINE artificial surfaces; reservoirs capped at 100 ha, lakes included; upper reservoir below 2,500 m. A depression whose footprint lies 20% or more within a mapped lake is removed: it is most often the same lake detected a second time. The usable volume of a developed depression is 90% of its volume.
[10] The reservoirs are the vertices of a graph, the candidate pairs its edges, weighted by their energy; we look for a maximum-weight matching (Edmonds’ algorithm, implementation from the LEMON library), solved exactly, connected component by connected component. The exact selection retains 1.4% more energy than the greedy heuristic of 2017, without changing the ranking of parameters in the sensitivity analysis.
[11] France, with identical thresholds: IGN’s RGE ALTI (25 m, lidar) 72 GWh, Copernicus GLO-30 (surface model) 394 GWh, brought down only to 156 GWh by a calibrated pruning of shallow depressions, FABDEM 60 GWh. Norway: over the country’s 163 tiles, 61,321 depressions with FABDEM versus 30,613 with lidar (−50% in number, −67% in volume); root-mean-square error of FABDEM of 4.9 m in the median tile. In the full pipeline, the Norwegian resource goes from 328.7 to 92.1 GWh (−72%) and the Swedish one from 67.3 to 18.5 GWh (−72%), while the usable volume of lakes changes by −0.4% in Norway and +0.6% in Sweden. Pairs of two lakes even gain 41% in Norway; those containing a dry depression collapse, because in a mixed pair it is the depression that sets the transferable volume. Outside France, Norway and Sweden, no national DEM was used: the dry-depression resource there is an upper bound, in Finland in particular.
[12] Z. Chen et al., “The World Karst Aquifer Mapping project: concept, mapping procedure and map of Europe”, Hydrogeology Journal, vol. 25, pp. 771-785, 2017. The test applies to the footprint of each reservoir to be built; the submitted version of the article tested the midpoint of the pair, which is more permissive. The two rules agree on 98.9% of pairs of two depressions; switching to the footprint costs 7.1% of the European energy without changing the country ranking. According to the same map (Table 5), karstifiable carbonate rocks are present under 21.6% of Europe’s surface, of which 13.8% at outcrop; in France, 35.0% of the territory at outcrop and 49.6% including covered areas. On the word and the landforms of karst: Larousse, “relief karstique” and “doline” (in French); on sotchs, French Ministry of Culture, Les Causses et les Cévennes, paysage culturel de l’agropastoralisme méditerranéen (in French), 2015; Fontaine de Vaucluse (mean flow of about 18 m³/s): UMR EMMAH and syndicat mixte du bassin des Sorgues (in French).
[13] P. T. Milanović, Water Resources Engineering in Karst, CRC Press, 2004; O. Bonacci, J. Rubinić, “Water losses from a reservoir built in karst: the example of the Boljunčica reservoir (Istria, Croatia)”, Environmental Geology, vol. 58, pp. 339-345, 2008. The resource excluded on karst grounds lies 99.5% on carbonate rocks (limestones, dolomites) and 0.5% on evaporites (gypsum, salt), whose dissolution during operation poses risks of a different magnitude. The exclusion is justified mainly in fully developed karst, of the Dinaric type, and it is most conservative in covered karst, where dry dolines are rare (Belgium, northern France, Norway). Vajont: “Vajont Dam” (Wikipedia) and “Vaiont Dam” (Encyclopædia Britannica); official toll of 1,917 dead; the respective roles of rain, reservoir level variations and earthquakes in triggering the slide remain debated.
[14] Figure S8 of the article’s supplement. This illustration comes from the French national calculation and classifies a pair as “on karst” based on its midpoint, the rule of that national study; the 94% is therefore a share computed on French data and not on the European reference, which tests the footprint of each reservoir. The 2017 study (note [8]) had no karst filter.
[15] Each filter is applied to the graph of candidate pairs, then the selection is entirely redone: a reservoir freed by a discarded pair can enter another one. Strict environmental screen: a pair is discarded as soon as the footprint of one of its reservoirs touches a Natura 2000 site (end-2024 version) or a protected area in IUCN categories II to VI (WDPA, September 2026); −30% of the energy and −31% of the sites. On the full OpenStreetMap network, streams included, the same 20 m buffer would remove 60% of the reference, but this is a bound set by the uneven mapping of small watercourses from one country to another rather than by hydrology. The distance-to-head ratio (L/H) is computed with the straight-line distance: the actual route of a penstock is longer, so this filter is optimistic. With L/H ≤ 15, 5,231 sites and 117 GWh remain; with L/H ≤ 5, 759 sites and 25 GWh. The three screens combined (environment, rivers, L/H ≤ 10) leave 1,375 sites and 0.03 TWh.
[16] Consumption: Eurostat, Electricity and heat statistics, EU-27 final electricity consumption in 2024: 2,378 TWh (sum of sectors; 2,464 TWh of electricity available for final consumption), i.e. 0.27 to 0.28 TWh per hour on average; 0.24 TWh covers about 50 minutes of it. Usable storage of the Union’s pumped-storage plants, 0.5 to 0.6 TWh versus the 1.3 TWh often announced: note [2]. Battery fleet: E. Quaranta et al., Clean Energy Technology Observatory: Hydropower and Pumped Storage Hydropower in the European Union — 2025 Status Report, JRC, 2025. Pairs of existing reservoirs: Gimeno-Gutiérrez and Lacal-Arántegui (note [7]). For seasonal storage, studies of 100% renewable systems turn to hydrogen.
[17] Global sensitivity analysis (Sobol indices, Jansen estimator): 4,000 base rows and 40,000 evaluations, each redoing the exact continental selection, intervals from 500 resamplings. Total indices: maximum distance between reservoirs 0.49, karst treatment 0.48, maximum distance to the grid 0.14, energy cap per site 0.13, minimum head 0.020, minimum energy 0.025, lake drawdown 0.004, altitude cap 0.001. Over the whole experimental design, the total ranges from 0.8 to 2,277 GWh, with a median of 148 GWh and 80% of cases between 19 and 636 GWh: this is an envelope over deliberately wide definition ranges, not a confidence interval. Four of the eight reference values lie at the edge of their range: the sensitivity to these four parameters is measured in one direction only.
[18] Supplement of the article, Tables S4, S14 and S15. The CORINE map sees 19% of the water bodies of IGN’s BD TOPO by number, but 73% in the 25 to 100 ha range that feeds the model. Natura 2000 or protected area in IUCN categories II to VI: 53.5% of the French reference energy, 34.7% for all 37 countries; these are exposed shares, not the loss after re-selection. Substations: OpenStreetMap power=substation layer, whose completeness varies from country to country (90.6% of French sites have a substation within 5 km). The proximity of a substation says nothing about its hosting capacity.
[19] The model counts five investment items and 34 parameters, published with the code (Table S11 of the supplement). Applied to an independently published 130 MW European project, with a head close to our median, it reproduces its investment cost to within 7%; this is a consistency check, not an independent validation, since some unit costs are calibrated on that same project. The comparison with large European pumped-storage plants relies on the JRC report cited in note [16]. With the same ±50% variations in unit costs, the energy below €500/kWh goes from 67 GWh to a value between 17 and 161 GWh. Reservoirs to be developed are counted as natural depressions: earthworks of €5 per m³ of usable volume (a range of €2 to €15/m³ for new off-river reservoirs), a membrane at €15 per m² of footprint and a fixed cost per reservoir; no dyke is counted.
[20] A. Morabito, P. Hendrick, “Pump as turbine applied to micro energy storage and smart water grids: A case study”, Applied Energy, vol. 241, pp. 567-579, 2019. The average efficiency of the Union’s fleet (0.71) comes from note [2].