Here you will find all my LinkedIn posts since September 2026. This page gathers, for each post: the text, the figure in English and in French, the primary sources, the prepared data and the code that reproduces the figure. More often than not, the figure also comes in an extended version: interactive, over other years, other countries, other units or other readings than the one in the post.
These pages are not blog articles: subscribers receive no email for them, and comments happen on LinkedIn. The longer articles stay on the home page.
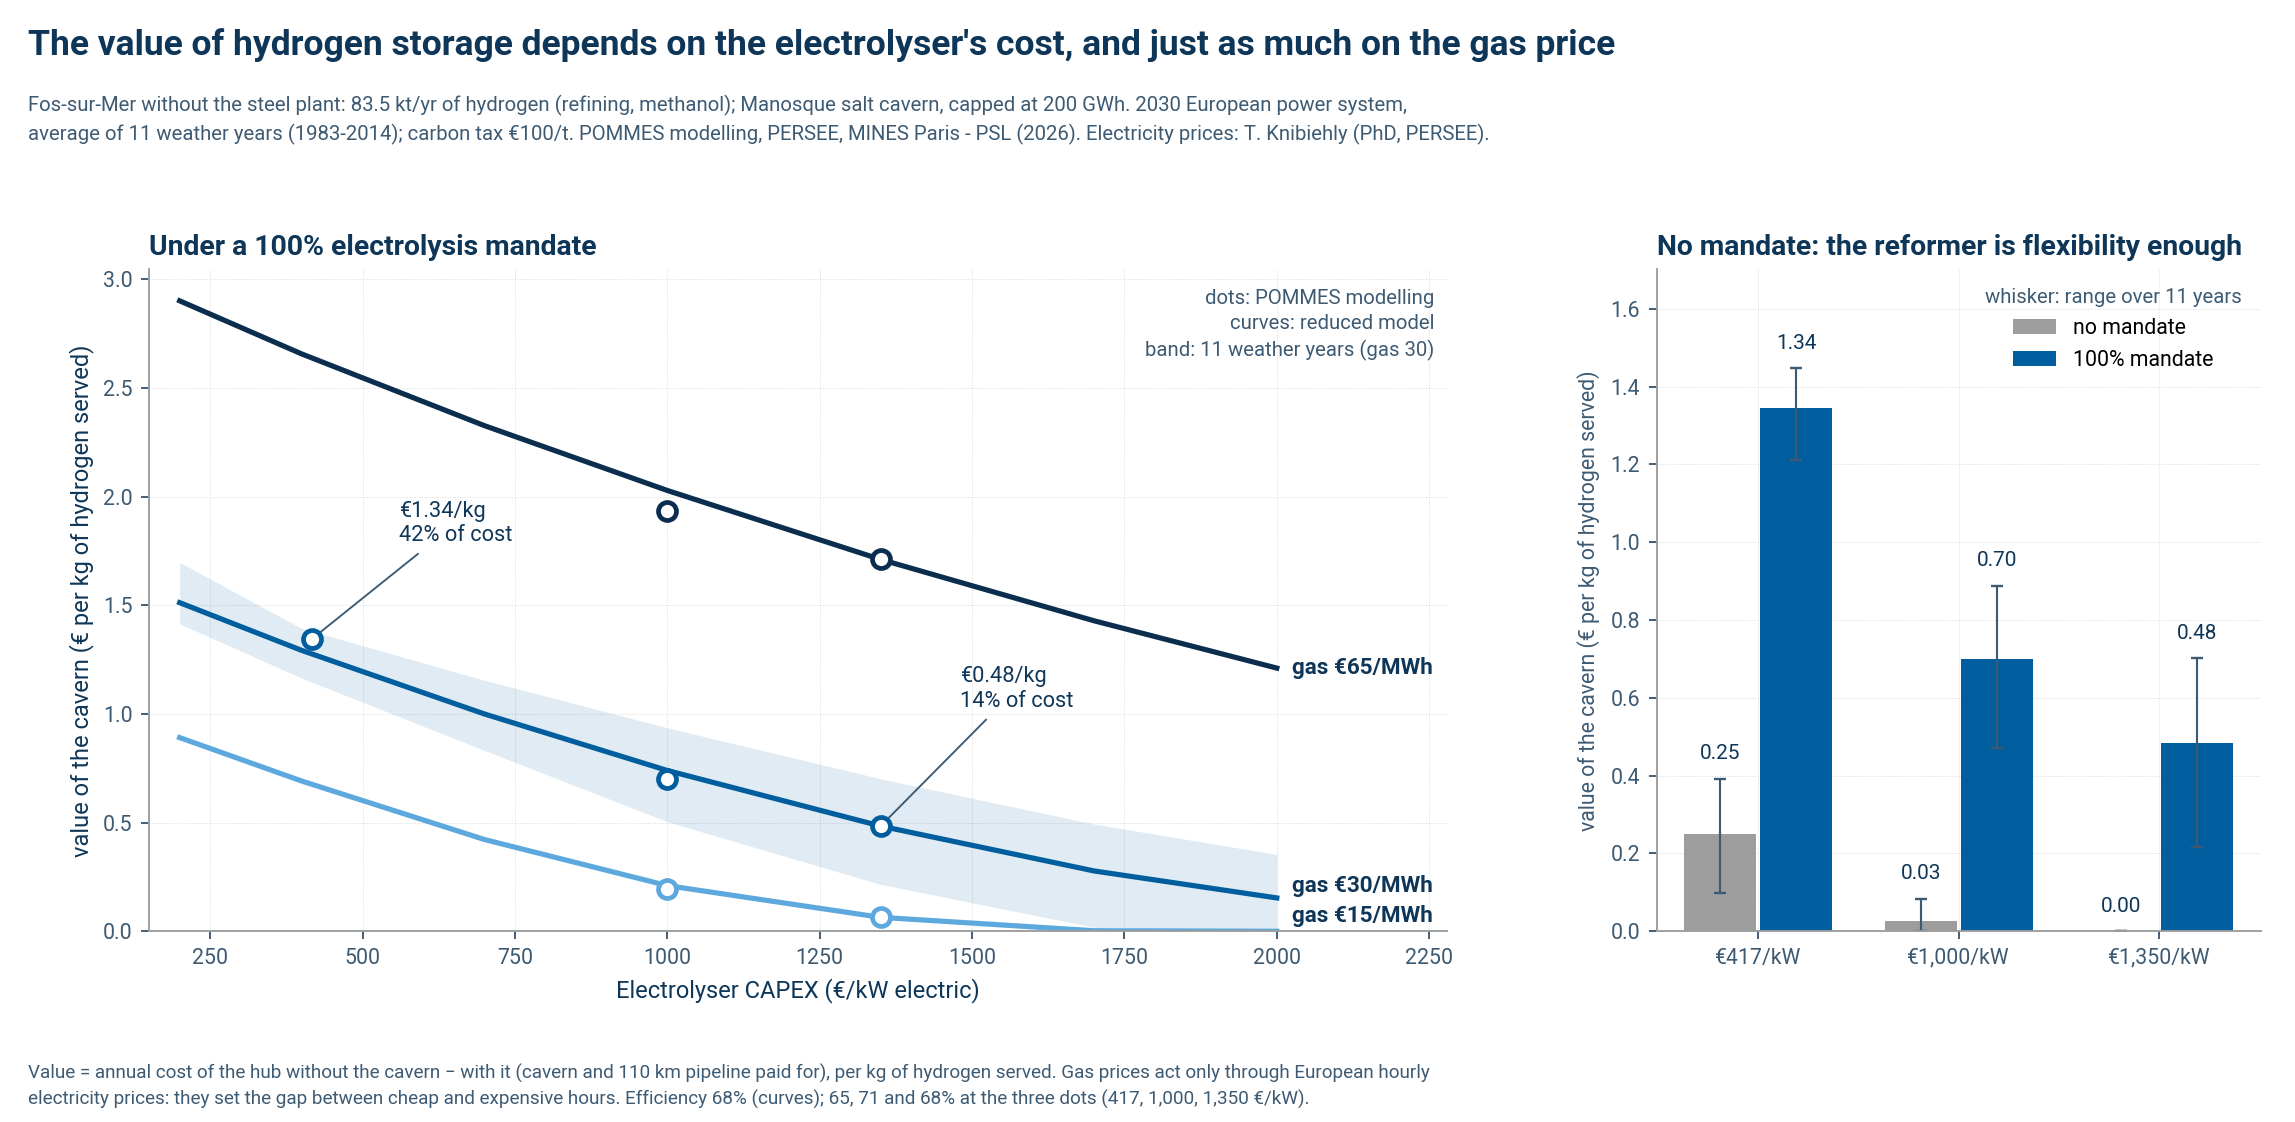
What is hydrogen storage worth? The Fos-sur-Mer case
If Fos-sur-Mer had to make its 83.5 kt of hydrogen a year entirely by electrolysis, the Manosque salt cavern would be worth €0.48/kg with an electrolyser at €1,350/kW and gas at €30/MWh, €1.34/kg at €417/kW, and from €0.06 to €1.71/kg as gas goes from €15 to €65/MWh. Without a mandate, at the central electrolyser price, it is worth nothing: the gas reformer already provides flexibility.
Figure, sources, data and code · the post on LinkedIn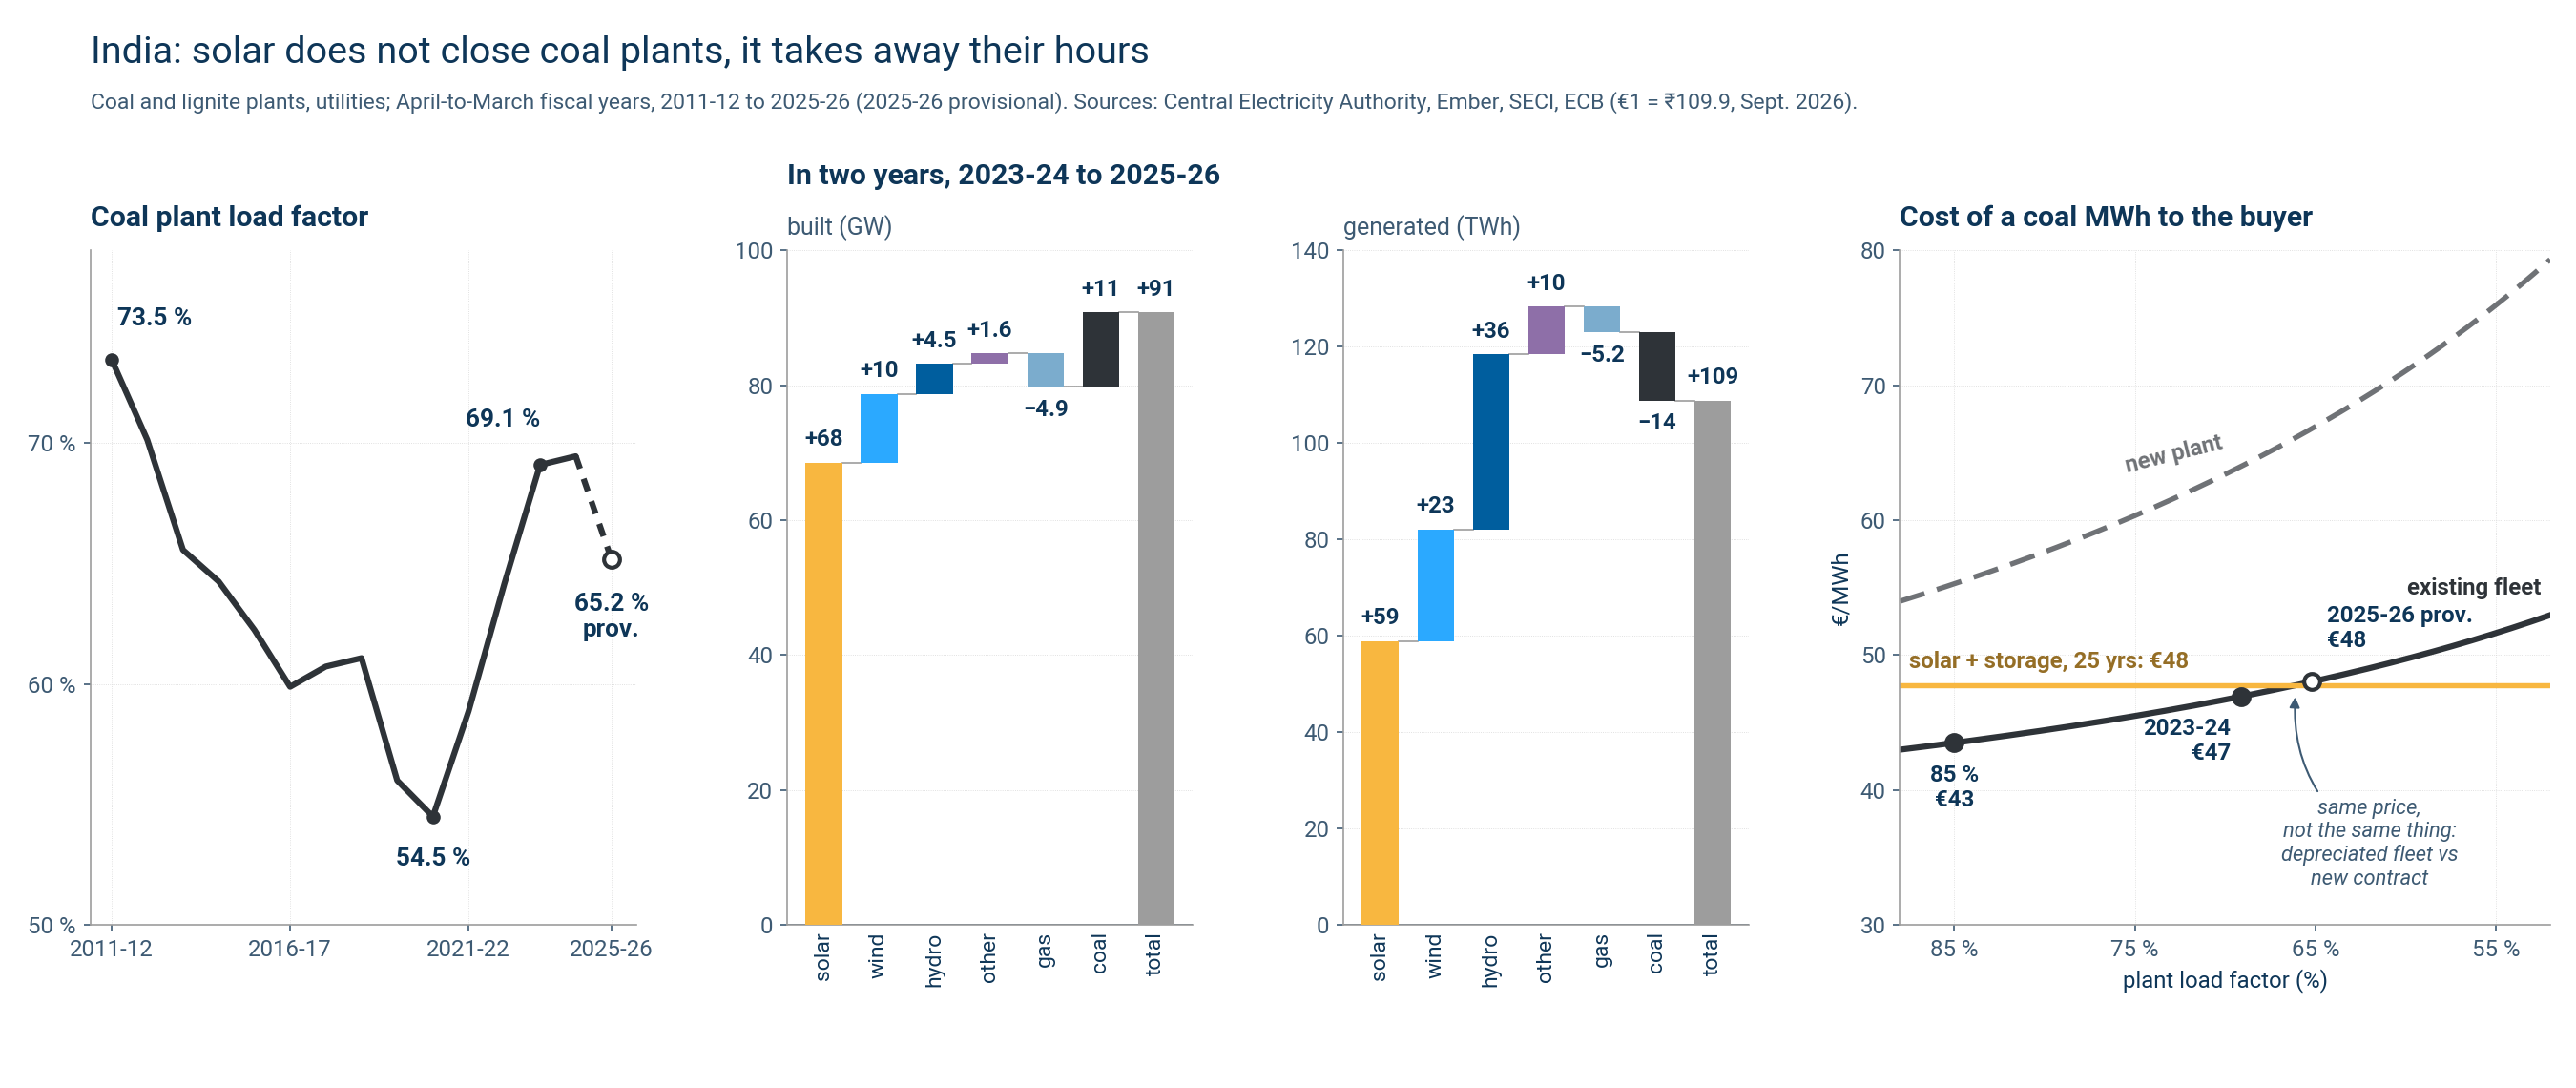
Solar PV versus coal
In two years, India has added 11 GW of coal plants and 68 GW of solar, and its coal generation has not moved. Solar does not close plants: it takes away their hours. And because Indian coal is paid under 25-year contracts, every lost hour makes the remaining MWh dearer, while solar with storage is now awarded at €48/MWh.
Figure, sources, data and code · the post on LinkedIn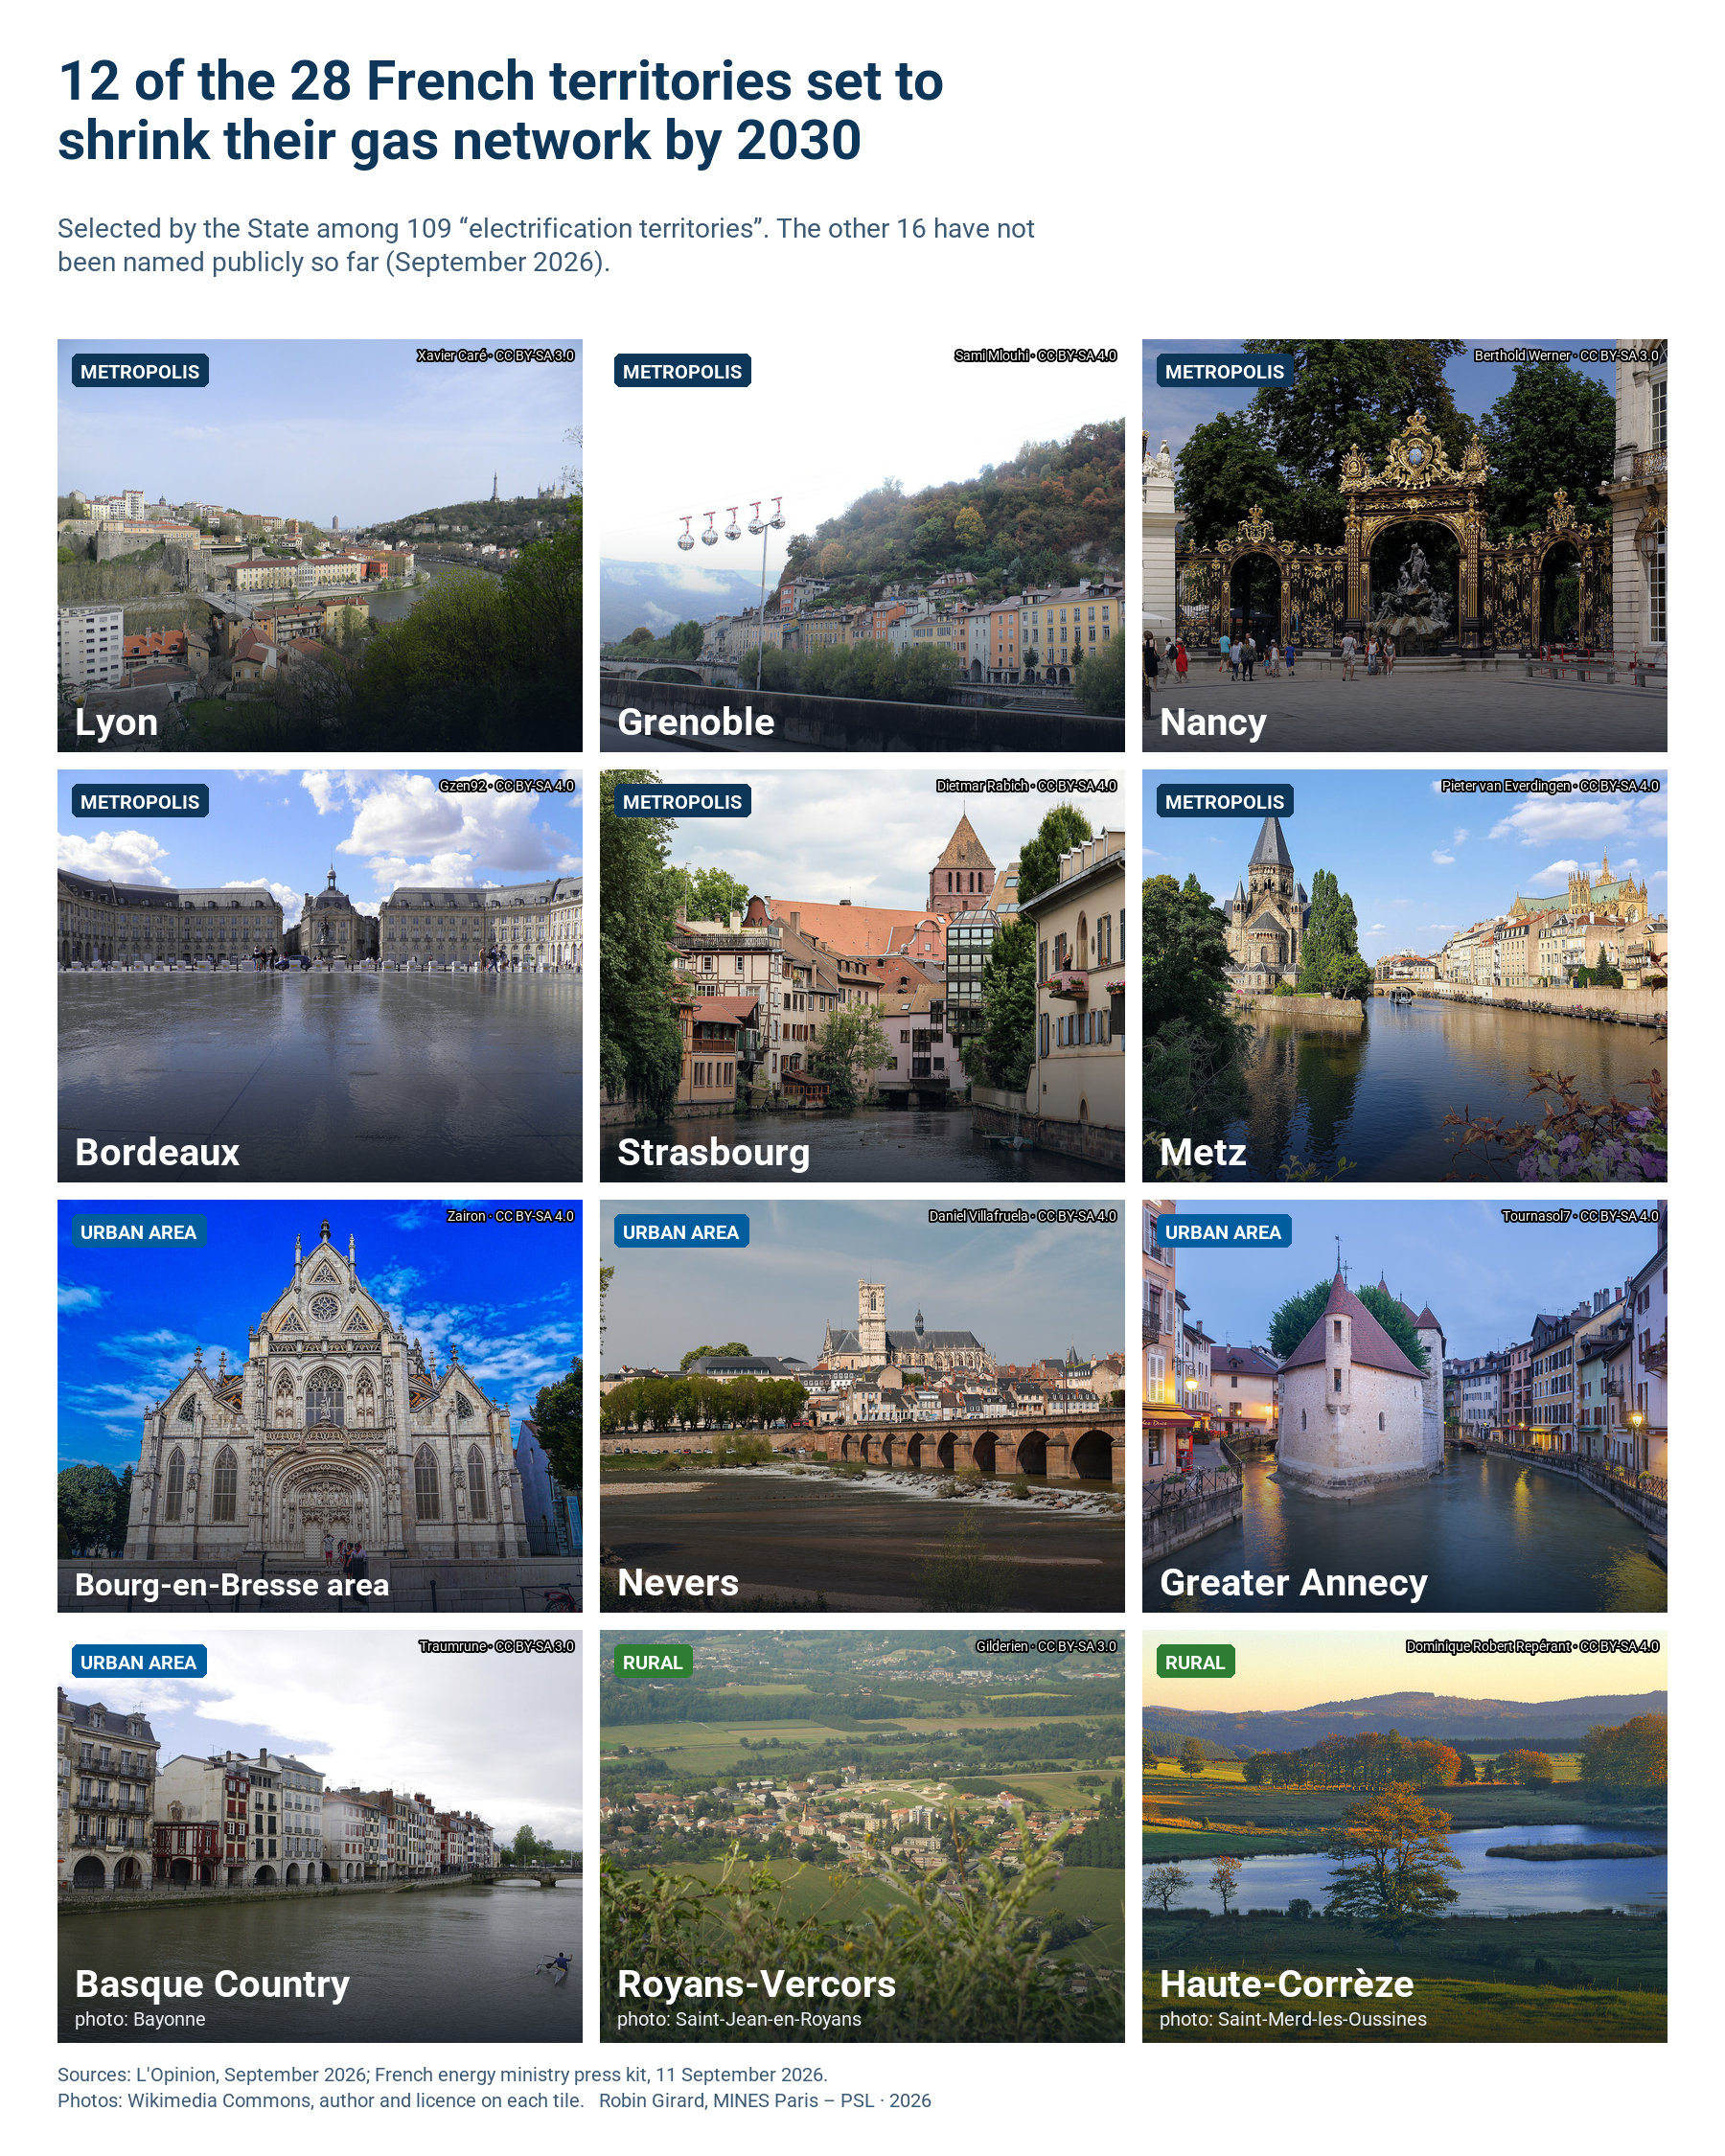
Twenty-eight territories to leave gas behind: the right call, without the method
The French state has selected 28 territories out of 109 to shrink their gas distribution network by 2030. The case is sound: a capital-intensive network losing its volumes concentrates the bill on the customers who remain. But closing a pocket of gas network is not a gas decision — it is a trade-off between three networks, and the value of the gas network lies partly in the electricity reinforcement it avoids. No one in France has computed that at a fine spatial scale.
Figure, sources, data and code · the post on LinkedIn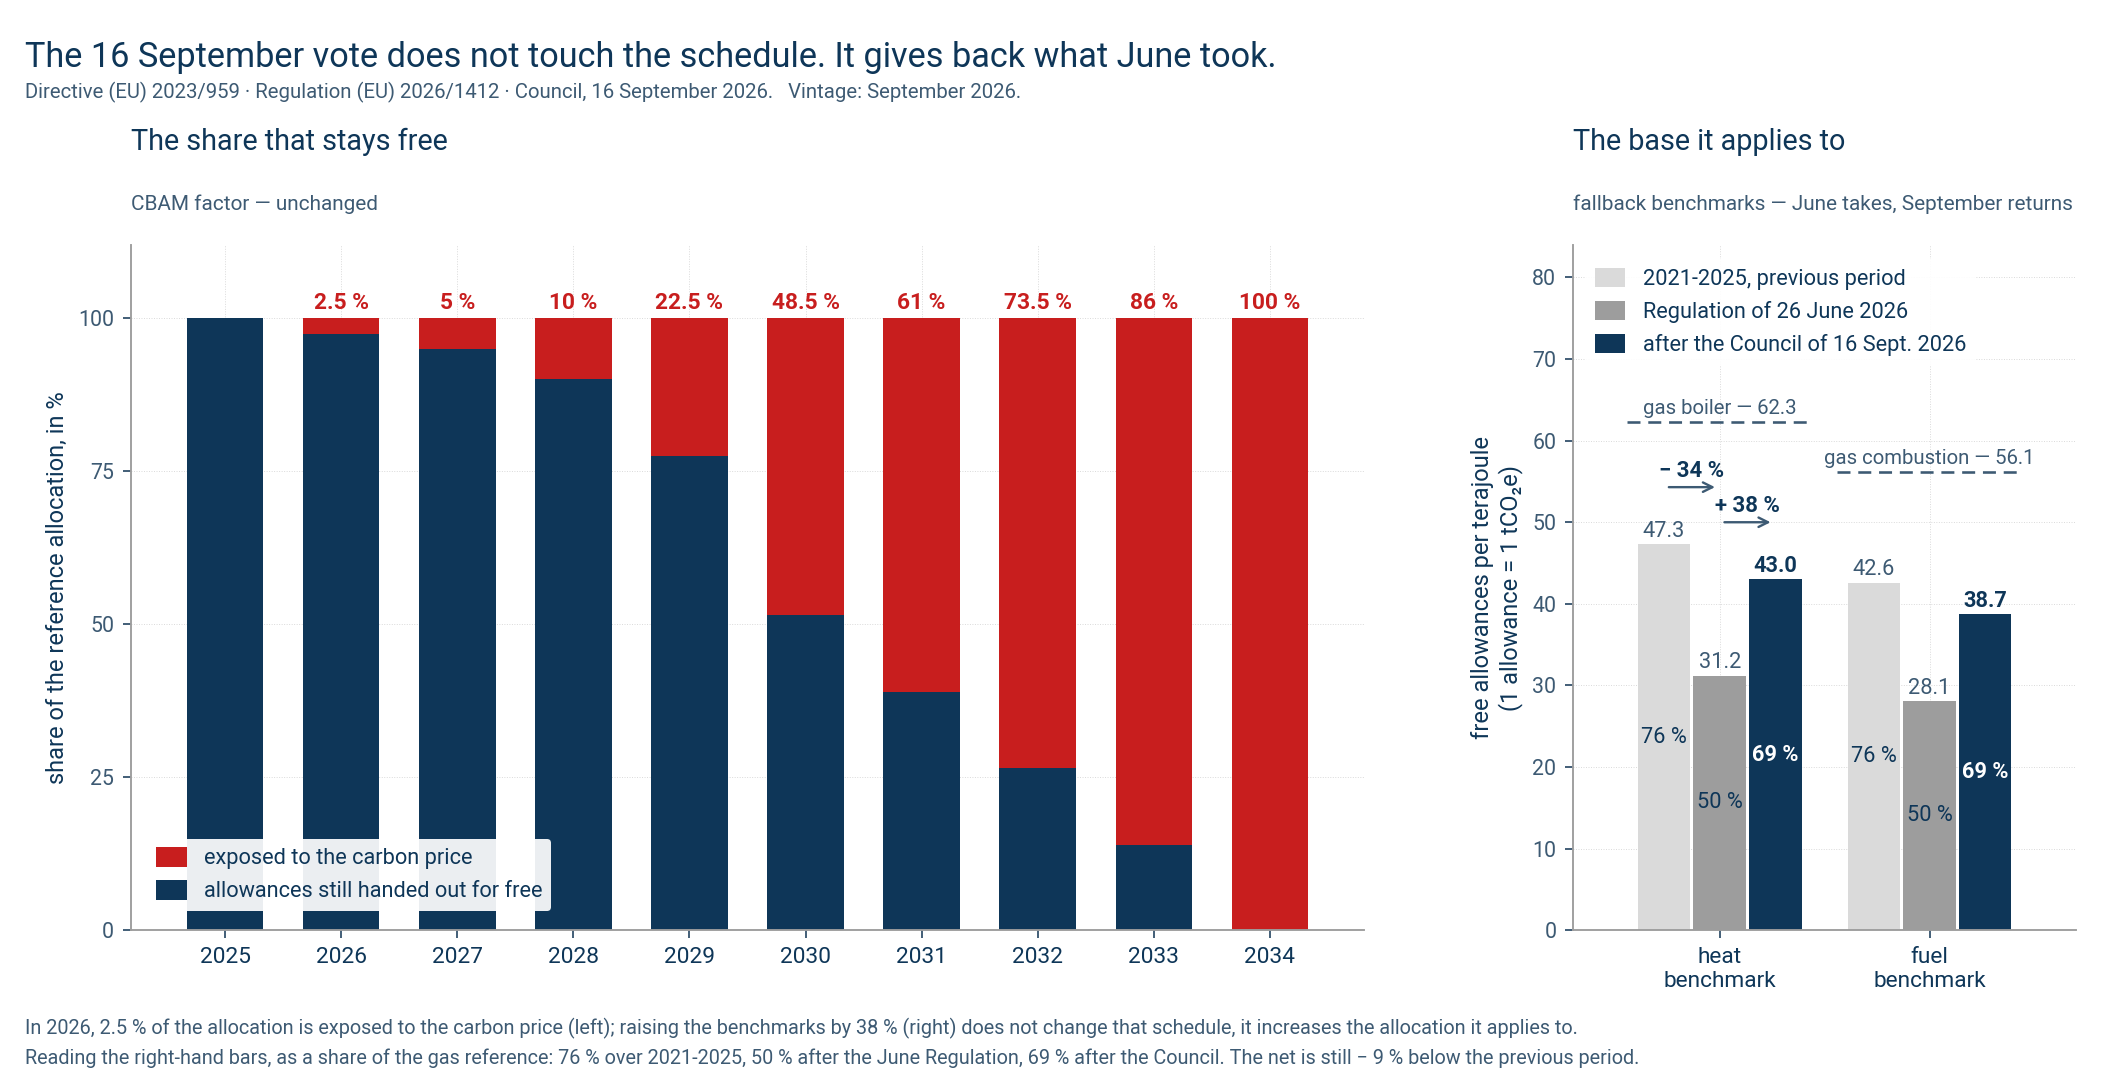
June takes, September gives back: the week Europe corrected itself
On 15 September 2026 the European Parliament extends CBAM to some 180 processed products. On the 16th, the Council hands 88 + 33 million free allowances back to heavy industry, six billion euros. The second move corrects a Commission regulation three months old, one that already announced its own correction in its preamble. And it does not give everything back: the allocation returns to 69 % of the gas reference, against 76 % over 2021-2025 and 50 % after the June regulation.
Figure, sources, data and code · the post on LinkedIn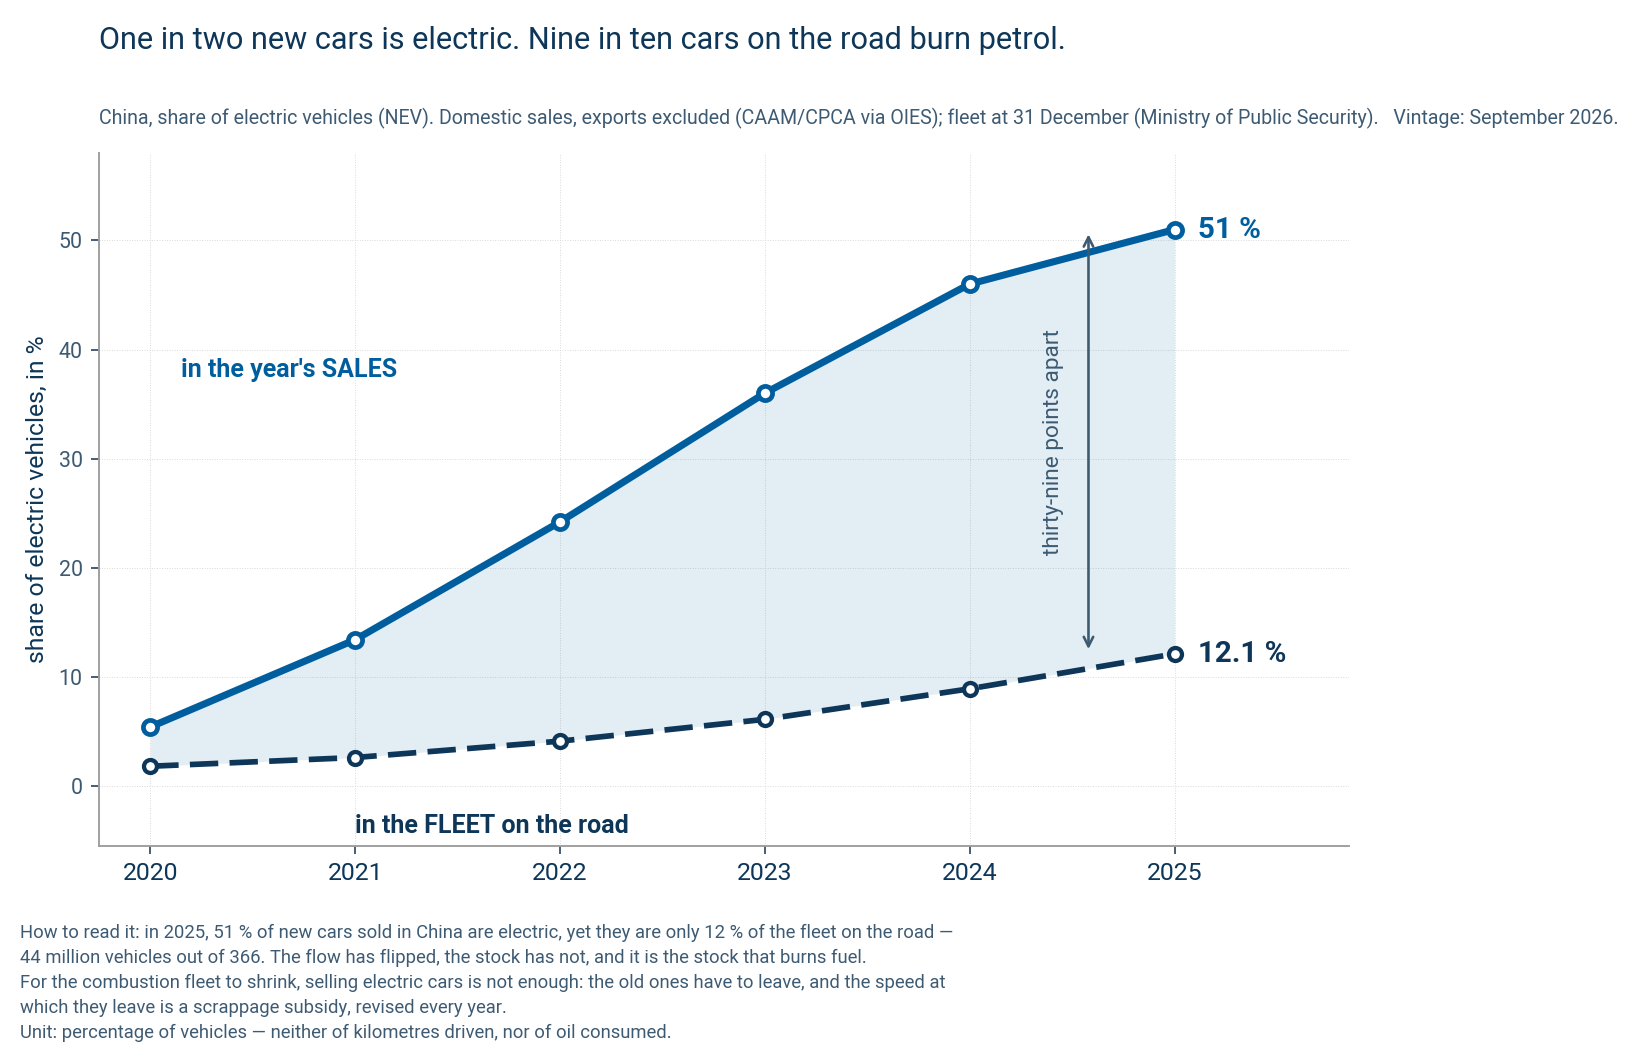
China's combustion fleet, and what actually decides its oil peak
One in two new cars sold in China is electric, yet nine in ten cars on its roads burn petrol. The combustion fleet has only just stopped growing, and what will make it shrink is not electric sales but a scrappage subsidy, revised every year. As for China's oil peak, it will be decided at the steam crackers.
Figure, sources, data and code · the post on LinkedIn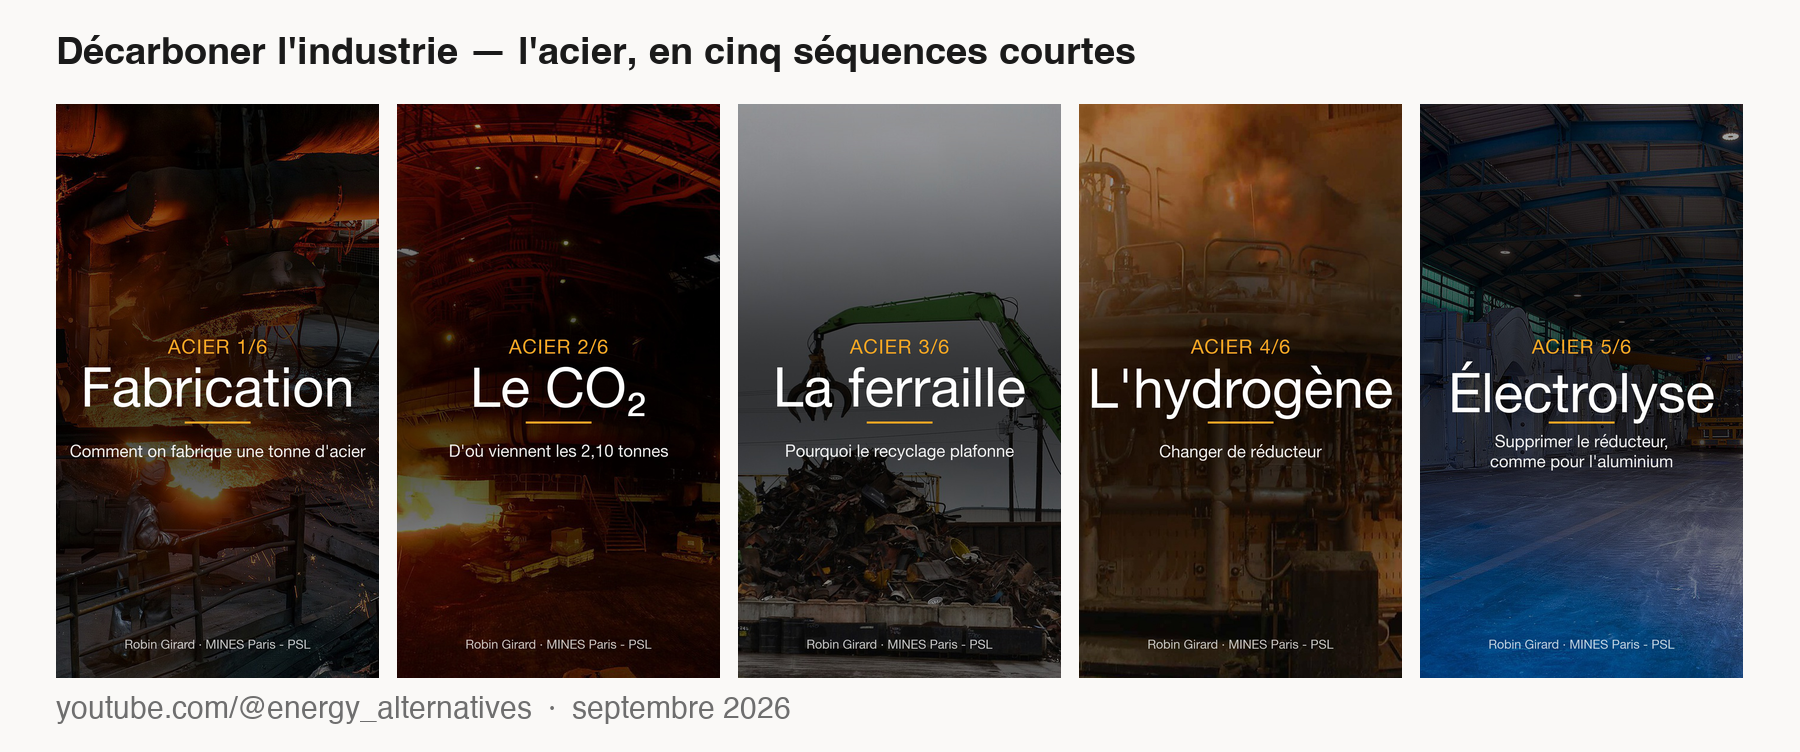
Hydrogen in European direct reduced iron, and what is moving in its place
ArcelorMittal left 1.3 billion euros of German subsidies on the table rather than build its two hydrogen-based direct reduction plants, and is investing the same amount in an electric arc furnace at Dunkirk. What blocks the route is not capital cost: it is a carbon price too low and hydrogen too expensive. Meanwhile the direct electrolysis of iron ore — SIDERWIN, now Volteron — is coming out of its pilot.
Figure, sources, data and code · the post on LinkedIn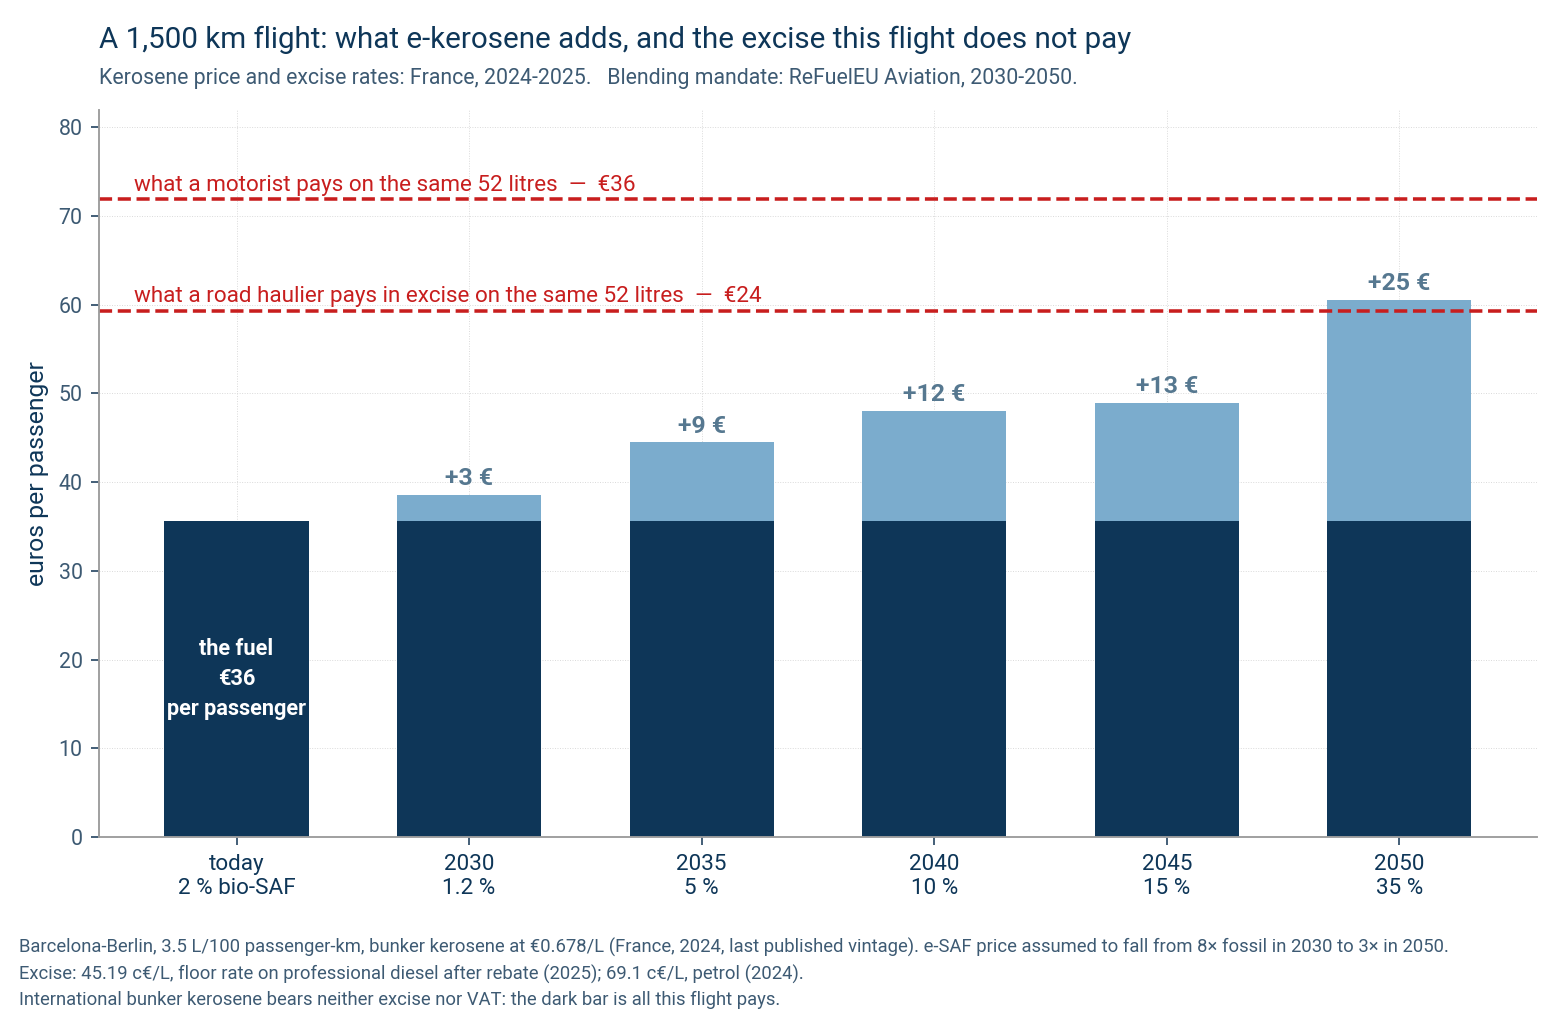
E-fuels, the price of a ticket, and the excise aviation does not pay
In 2026 aviation's fuel bill goes from 252 to 350 billion dollars on flat consumption. Airlines passed on 70 %, demand did not blink, and net profit per passenger fell from 9.10 to 4.50 dollars. What that says about e-fuels, whose European projects show abatement costs of the order of 1,500 €/tCO2: ticket prices will have to rise.
Figure, sources, data and code · the post on LinkedIn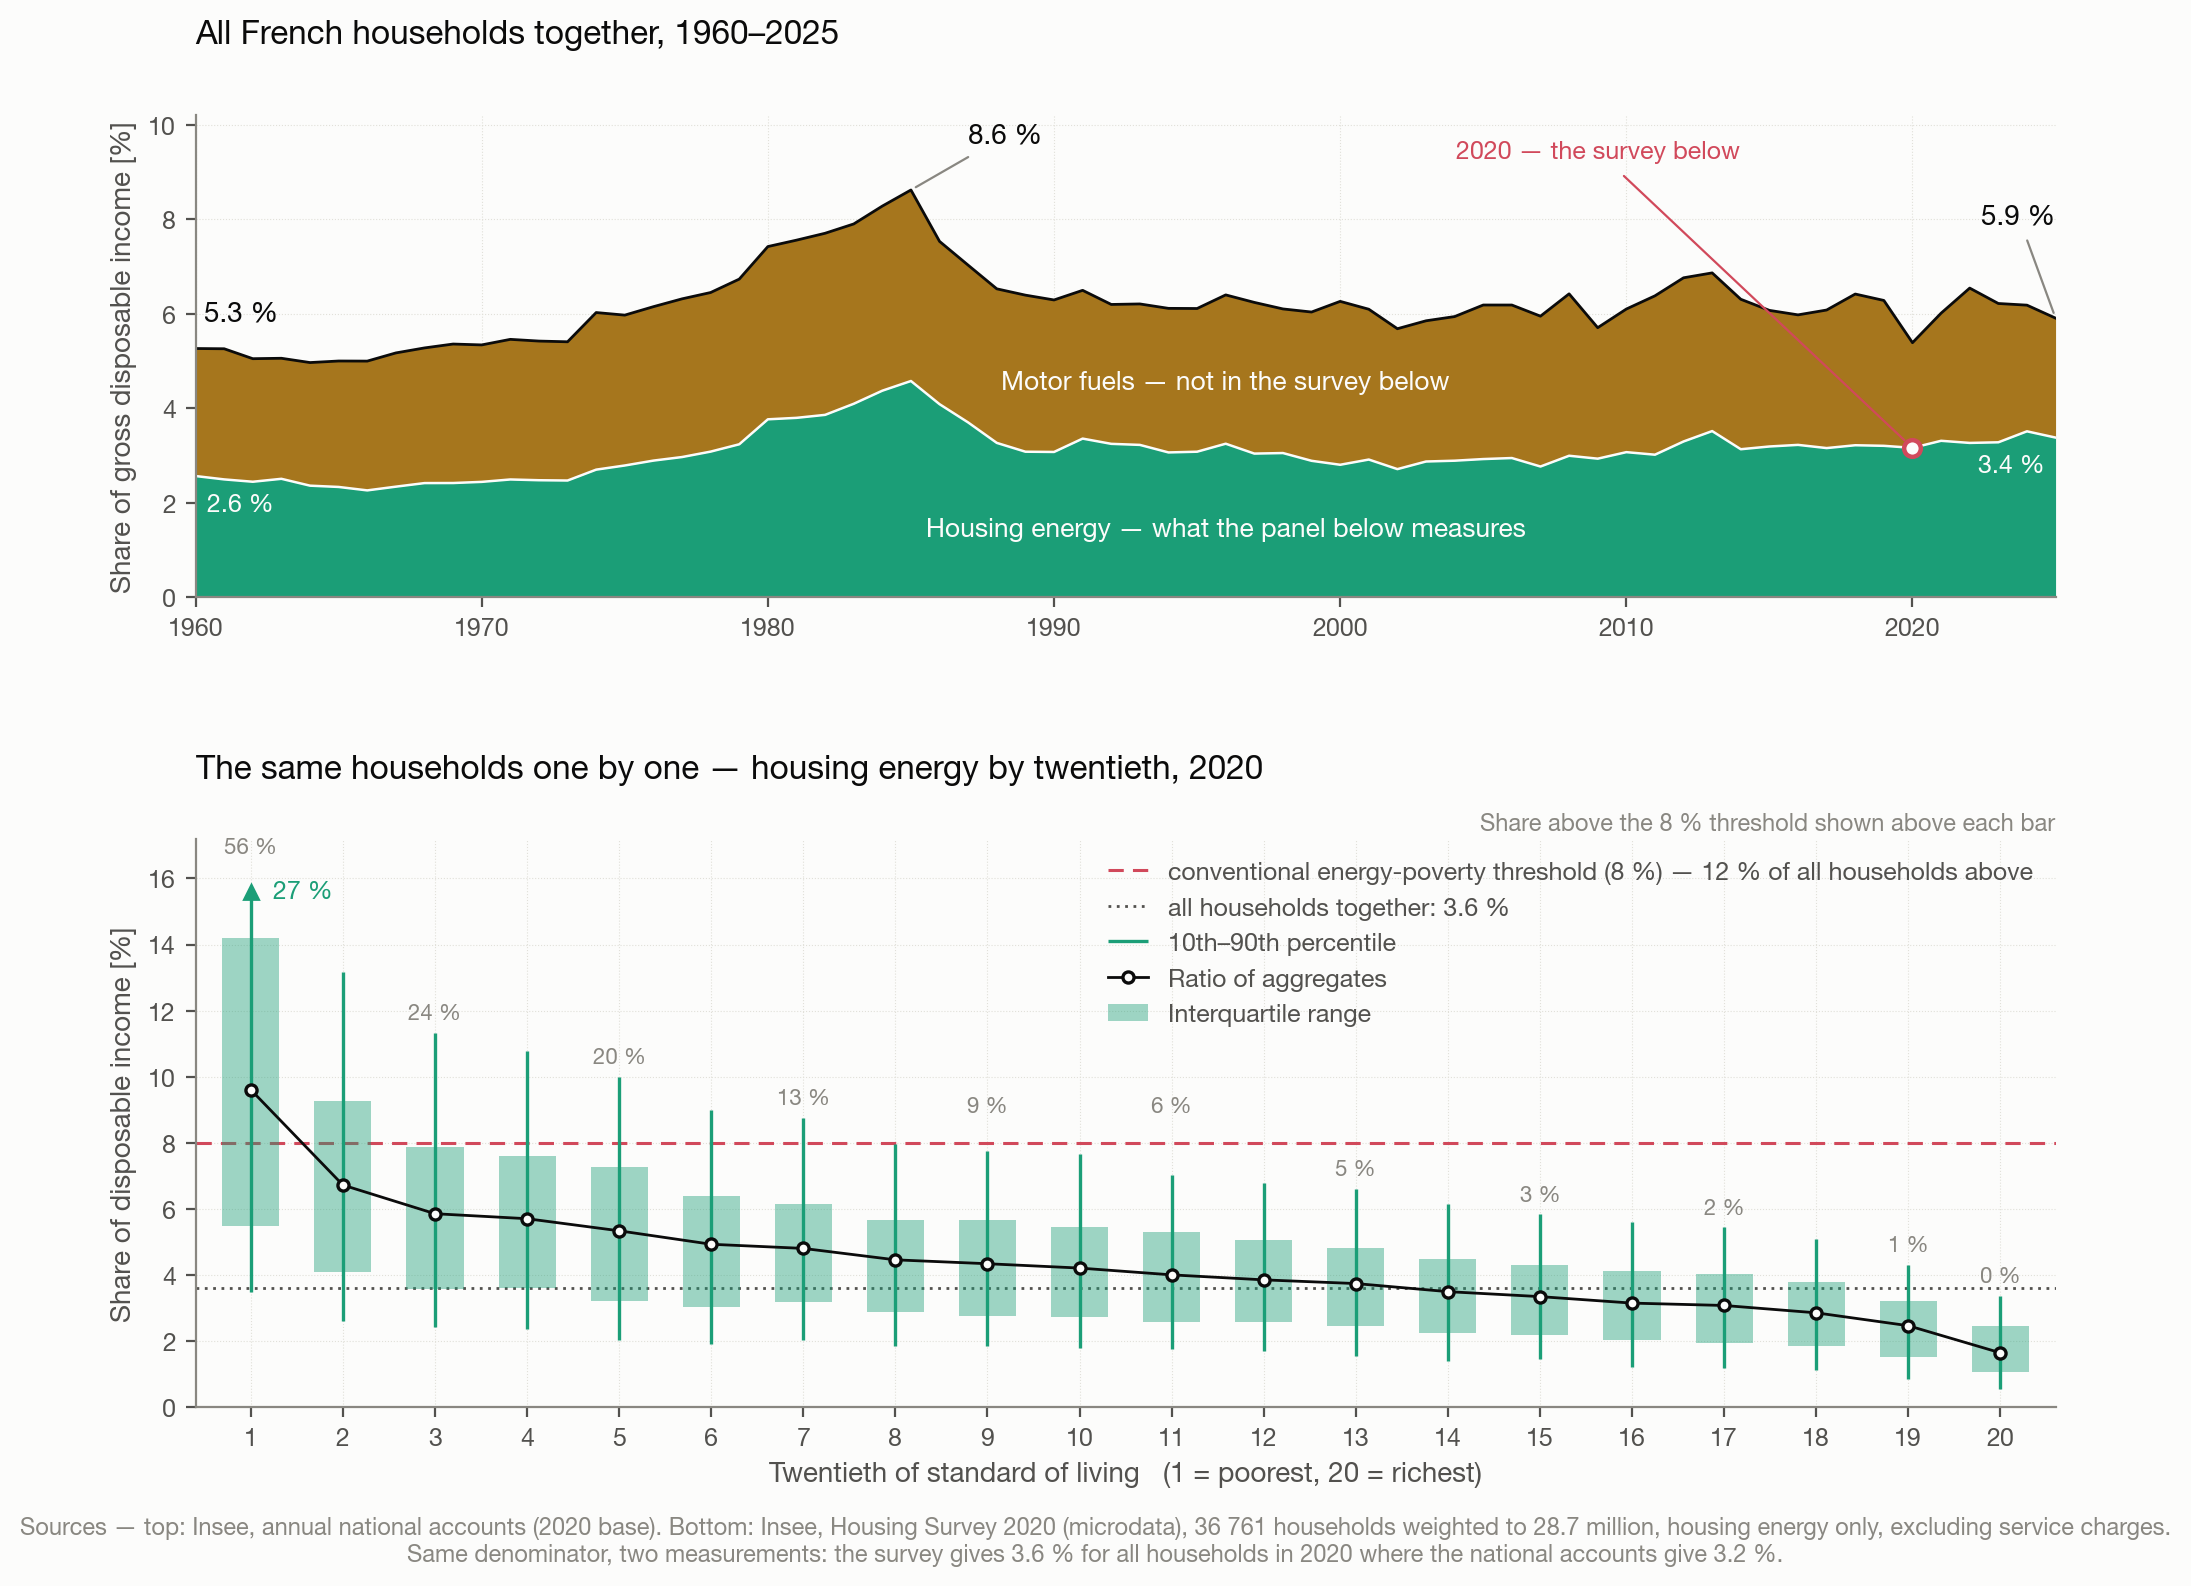
Energy inequality and the transition
The share of income the French spend on energy has barely moved since 1960; yet in 2020, 12 % of households cross the energy-poverty threshold on housing energy alone, and 56 % in the poorest twentieth.
Figure, sources, data and code · the post on LinkedIn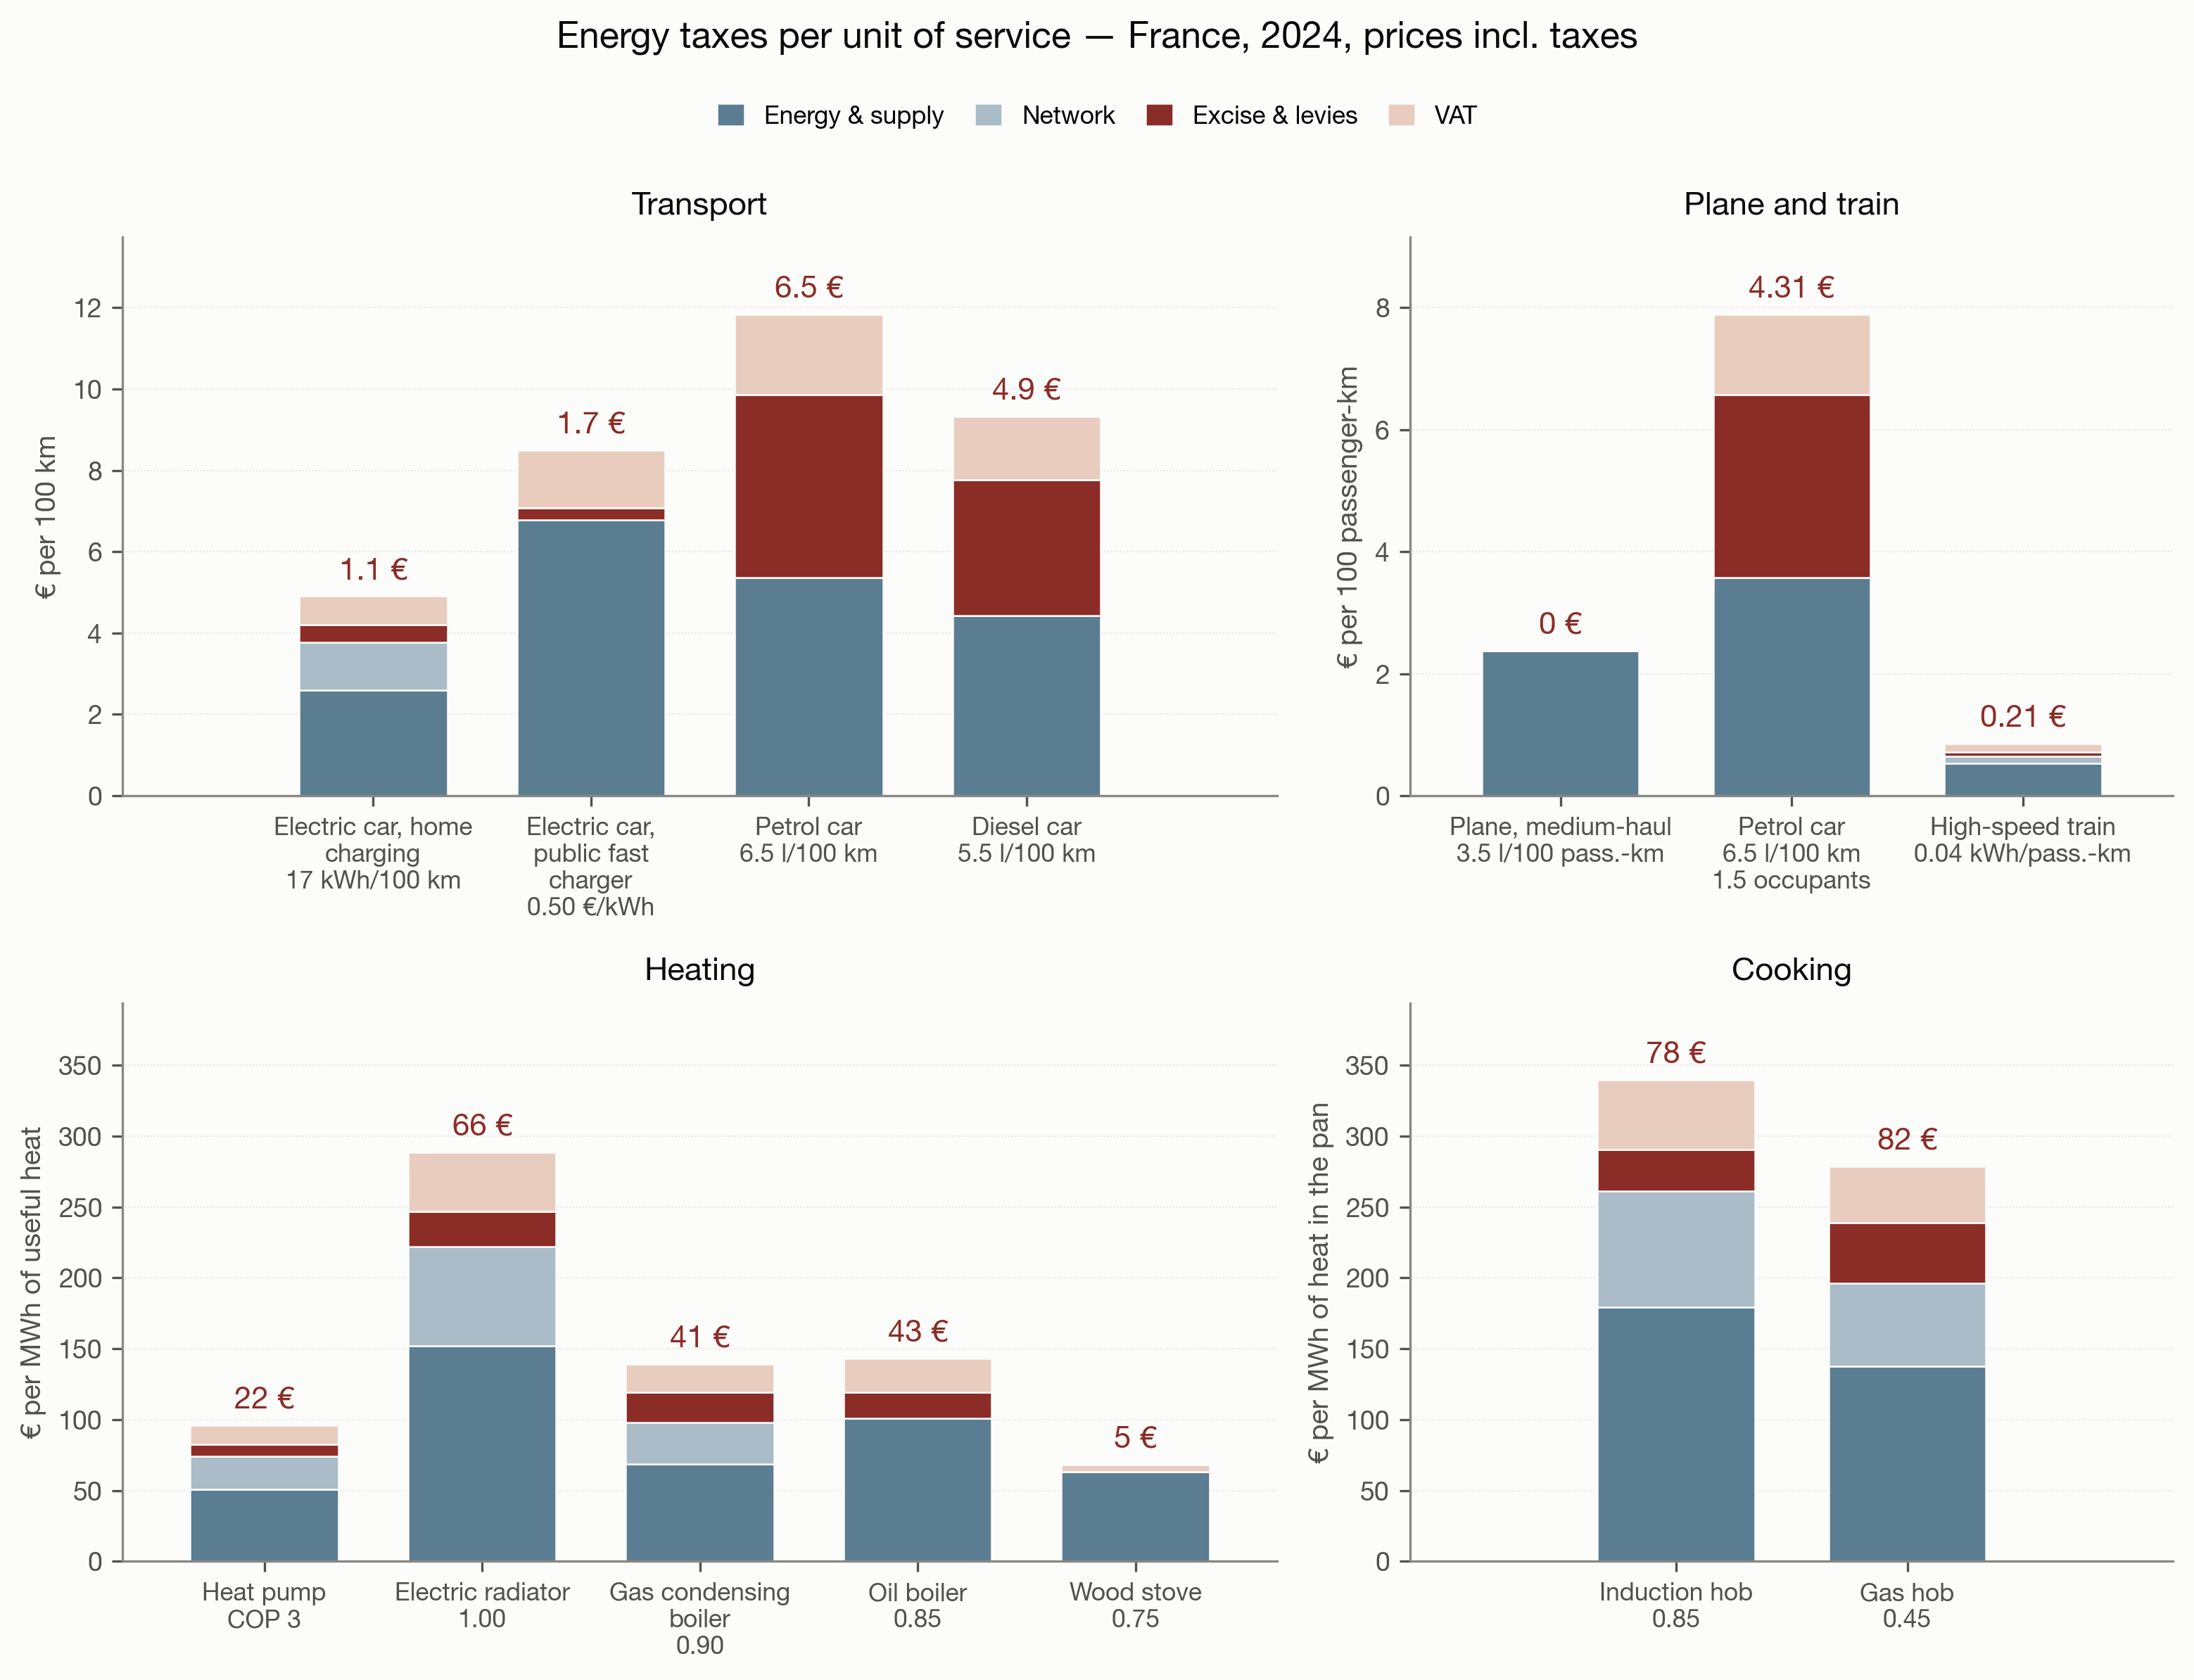
Energy taxes, by use and by carrier
A MWh of electricity is taxed more than a MWh of gas, but the two do not compare: between the MWh delivered and the service rendered there is the efficiency of the appliance. Per 100 km, per 100 passenger-km, per MWh of useful heat, per pan, the ranking changes — and the plane pays nothing at all.
Figure, sources, data and code · the post on LinkedIn
Oil, gas, electricity: what each costs the country, how much we use, what it brings in taxes
Trade balance, final consumption and tax revenue by energy carrier, France 2012-2024. In 2022 the energy bill doubles while taxes fall; the only carrier in surplus is the one taxed most relative to its trade contribution.
Figure, sources, data and code · the post on LinkedIn
Energy taxes in France: the whole picture
What a consumer pays per MWh of electricity, gas, wood or fuel, and what the State takes from it: energy taxation follows neither carbon nor energy content.
Figure, sources, data and code · the post on LinkedIn
PFAS, heat pumps and air conditioning: an accurate headline that misleads
Of 68,000 tonnes of PFAS emitted each year in Europe, close to 39,000 come from refrigerant fluorinated gases. But that total aggregates uses that have almost nothing in common. The post announcing the blog article.
Figure, sources, data and code · the post on LinkedInThe code of the figures, the prepared data and the scripts of the interactive charts are in the public repository linkedinposts; the courses these figures come from are on my teaching page.