The text of the post
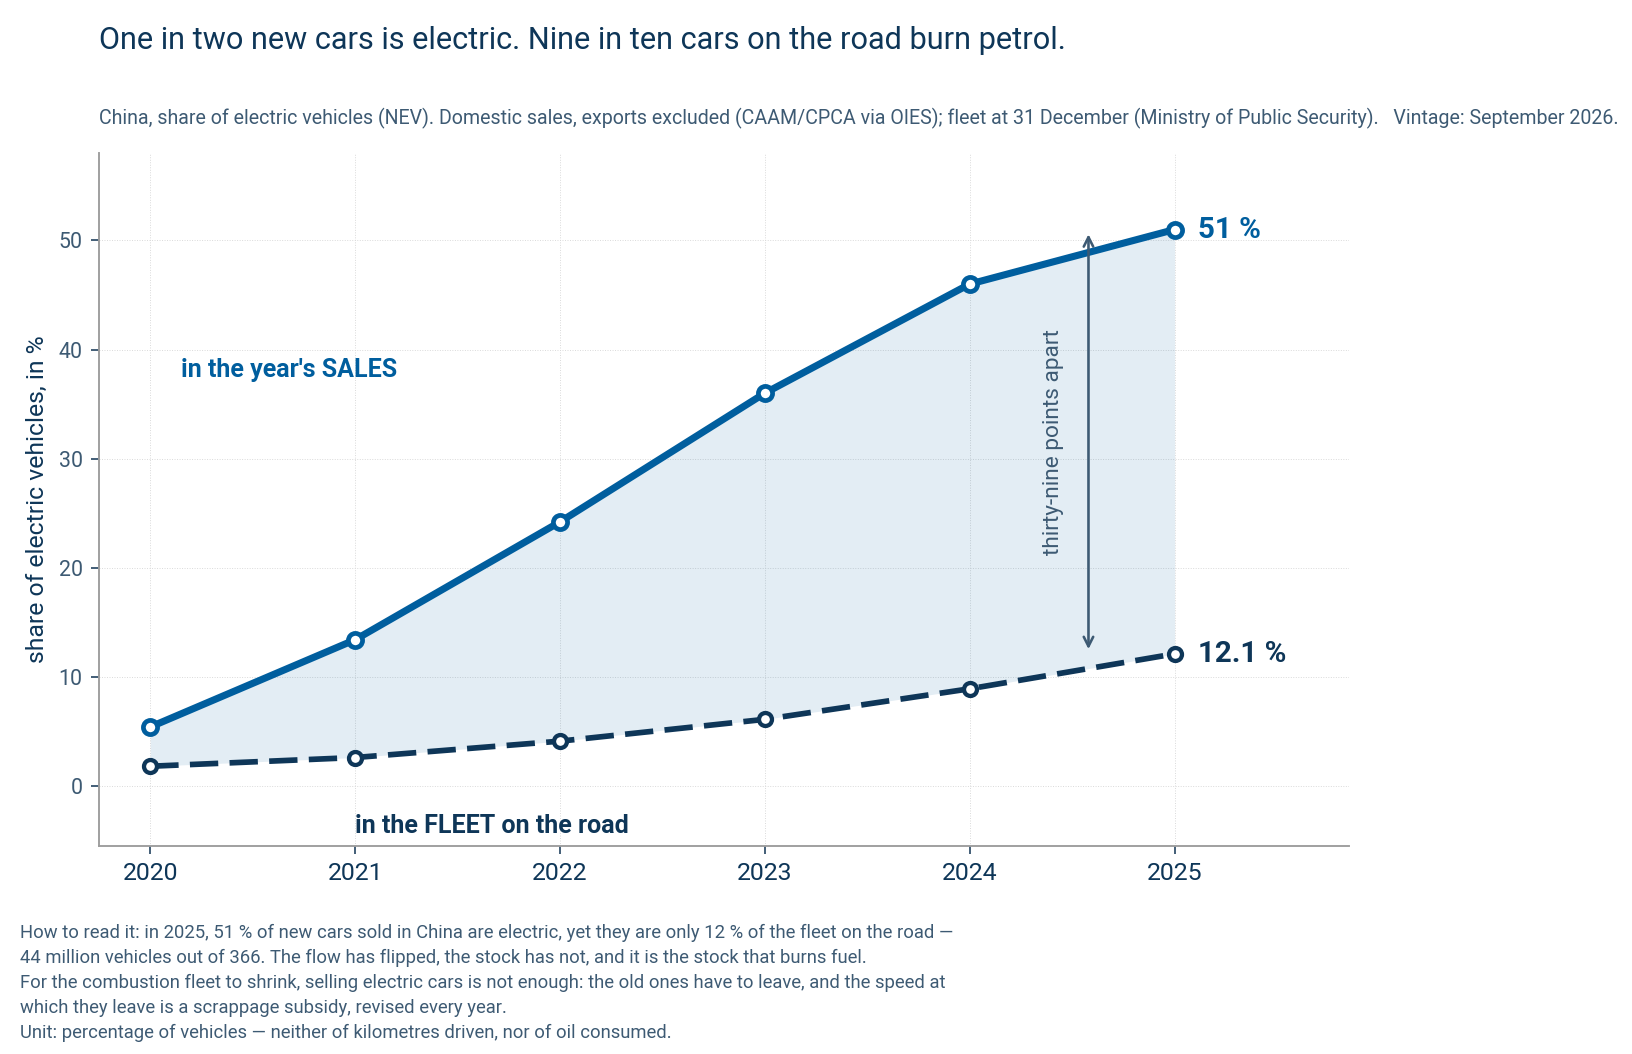
One in two new cars sold in China is electric. Nine in ten cars on its roads burn petrol.
That gap is the whole story. 44 million electric vehicles in a fleet of 366 million — 12 %. The flow has flipped, the stock has not, and it is the stock that burns fuel.
China’s combustion fleet stopped growing in 2025. It stands at 322 million vehicles against 321 a year earlier. That has never happened before.
For a fleet to shrink, selling electric cars is not enough: the old ones have to leave. And there a figure surprised me. Scrappage went from 6 million vehicles in 2023 to 12.3 million in 2025. It doubled in two years, while the fleet did not age two years in two years.
What moved is not mechanics, it is a subsidy. Beijing pays you to scrap and to buy in the same move, up to 20,000 yuan if the new vehicle is electric. Funding for the programme went from 150 billion yuan in 2024 to 300 billion in 2025. It comes back down to 250 billion in 2026, and the per-vehicle amounts are cut by 20 to 30 %.
In other words, the speed at which China retires its combustion cars is a budget line, revised every year. I ran the numbers: at today’s electric share, if that line deflates, China’s combustion fleet starts growing again. It takes both levers at once — selling electric cars and paying for scrappage — to make it genuinely fall.
Which leaves the question I care about, and it is the one in the poll above: when will China pass its oil peak?
The calculation gives an unexpected answer. Moving the vehicle fleet between two sharply contrasted assumptions shifts that peak by four years. Moving the pace of petrochemicals shifts it by more than fifteen — and if it does not slow down at all, the calculation finds no peak before 2050. Between 2019 and 2024, China added as much ethylene and propylene capacity as Europe, Japan and Korea combined.
China’s oil peak will be decided at the steam crackers, not at the carmakers.
Sources, chart and reproducible calculation in the comments.
What “scrappage” means here
- Scrappage is not published as such: it is derived by subtraction, domestic sales minus the change in the fleet. And it must be kept apart from subsidised “replacement”, which resells the vehicle second-hand and leaves it in the fleet. Only destruction counts here.
Sources
- OIES, China new energy vehicle update — parc, ventes intérieures, exportations, et le parc thermique qui cesse de croître (mars 2026)
- OIES, Rising new energy vehicle sales in China: falling gasoline demand, rising uncertainty — Energy Insight 167 (avril 2025)
- AIE, Oil demand for fuels in China has reached a plateau (mars 2025)
- AIE, China’s petrochemical surge is driving global oil demand growth — autant d’éthylène et de propylène ajoutés en 2019-2024 que l’Europe, le Japon et la Corée réunis
- ICCT, China’s expanded incentives for scrapping and replacing transportation equipment in 2025
- AIE, Global EV Outlook 2026 — le déplacement de pétrole par les véhicules électriques, et sa définition contrefactuelle en annexe A
Data
donnees_flux_stock.csv— The two curves as plotted, 2020-2025: share of electric vehicles in domestic sales and in the fleet on the road, with the NEV fleet and total fleet from which the latter is derived. Each year carries its provenance in the file header — the first three years of the sales series are not corrected for exports, and the gap is worth less than one point.
Code
The script build_figure.py produces the figure on its own.
To reproduce the figure:
python3 build_figure.py            # la figure, en français et en anglais
python3 bilan_parc_chine.py        # le bilan de flux et les deux scénarios
python3 pic_petrolier_chinois.py   # l'année du pic pétrolier chinois
The fleet balance has no fitted parameter: combustion fleet + combustion sales − scrappage, all three terms observed. It checks out on 2025 to within 0.4 million on 322. The projections rest on explicit assumptions and are upper bounds: gasoline intensity per vehicle is held constant when it is in fact falling.
All files of this post (figures, data, scripts) are in the folder 2026-09-18-parc-thermique-chinois of the public repository.
Code under the MIT licence; texts and figures under CC BY 4.0; data remain under their producer’s licence.