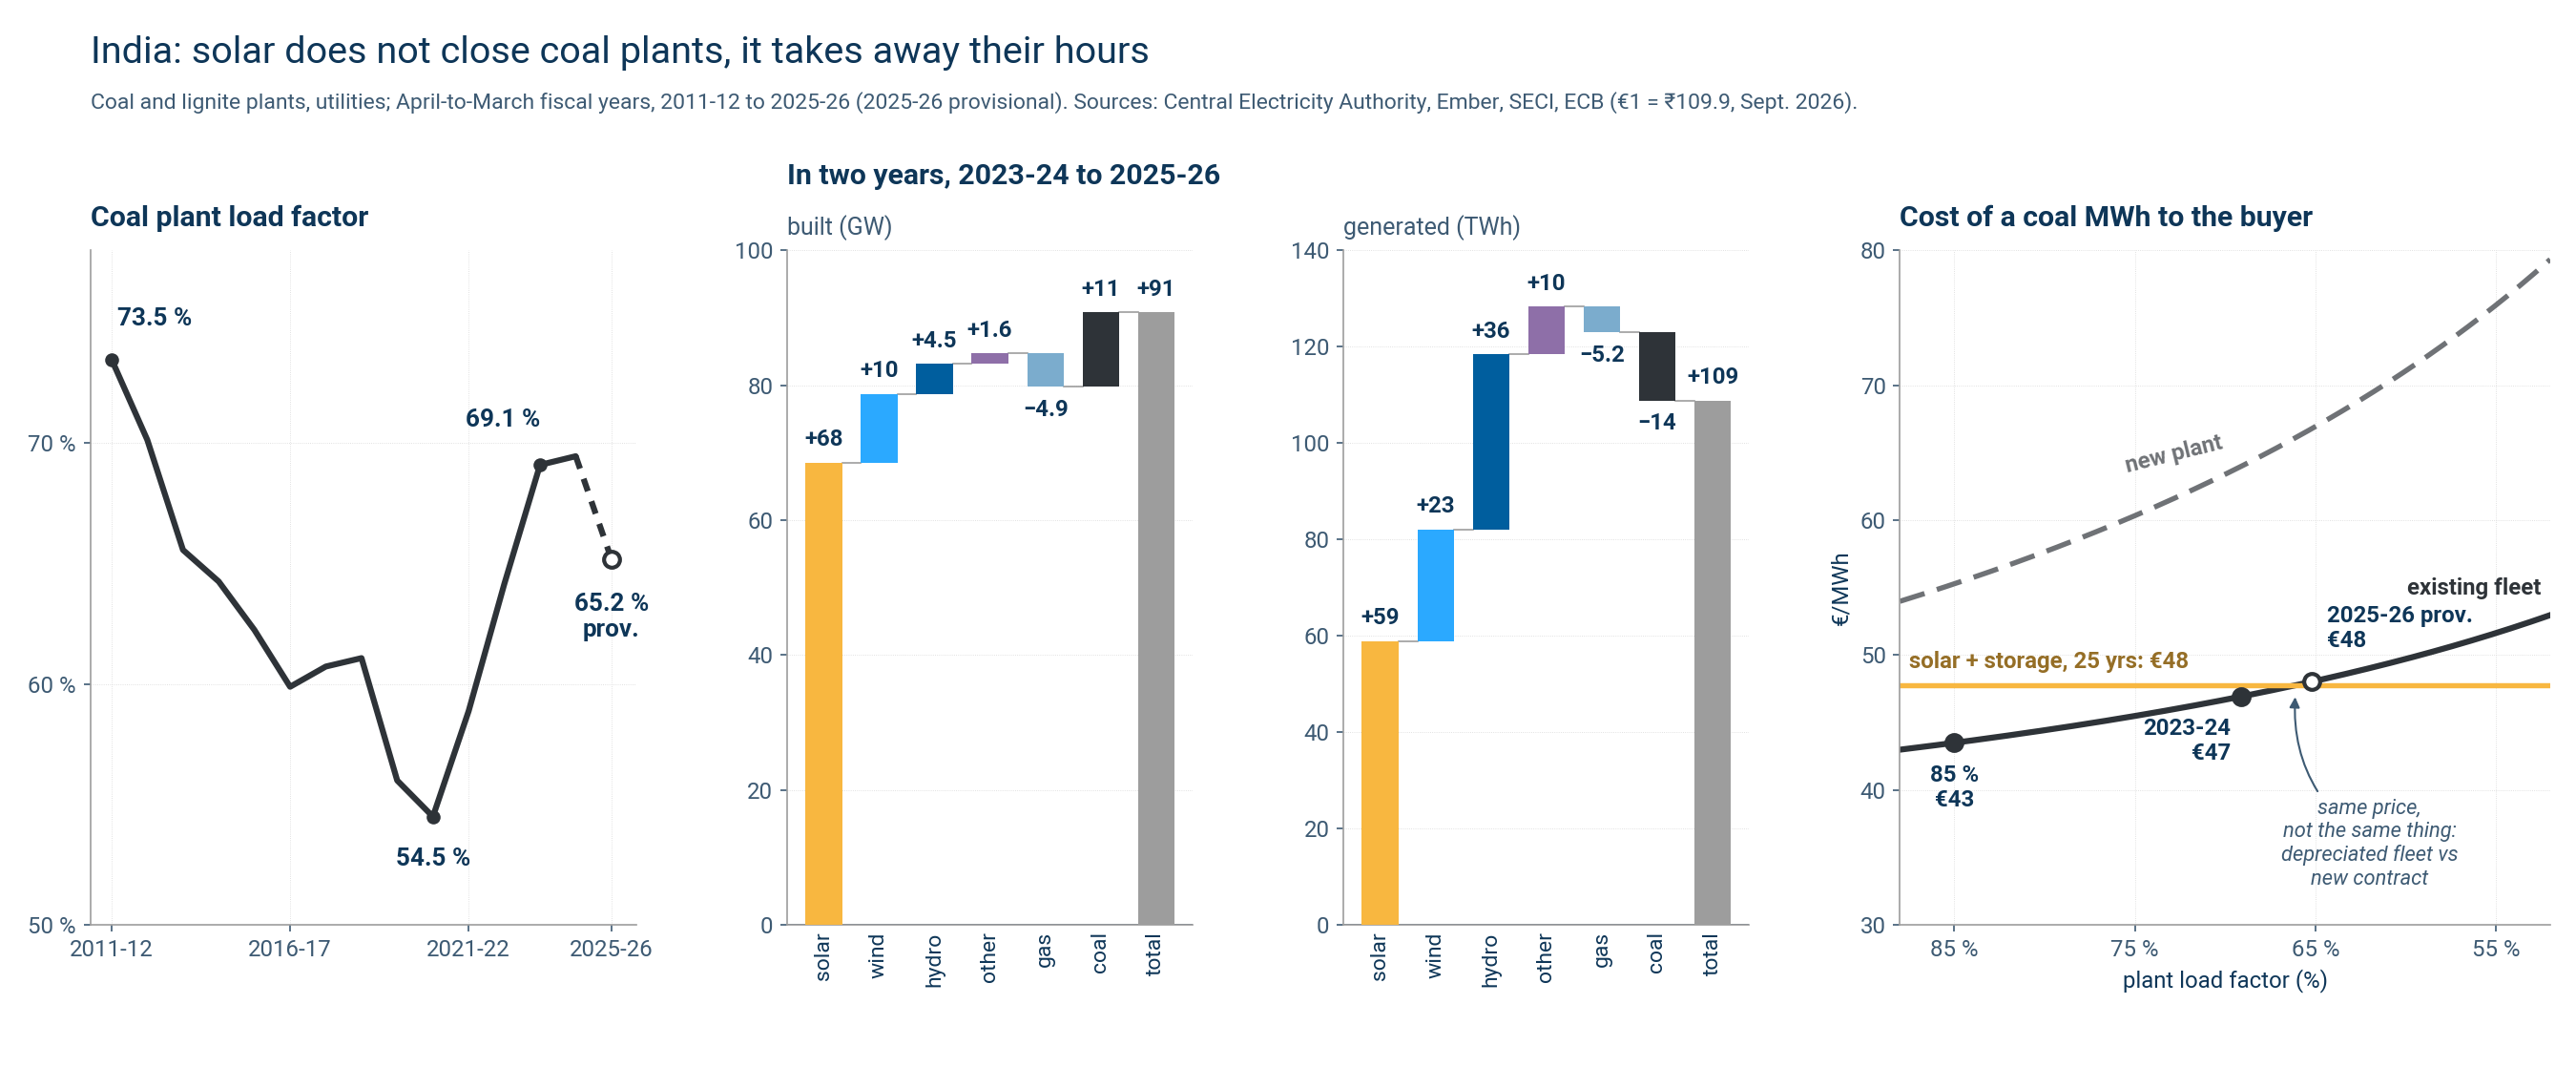
The 2025-26 point is provisional: the CEA will not publish its Growth Book 2026 until November. Capacity as on 31 March 2026 (228.56 GW) is primary; generation (1,281 TWh) and load factor (65.18 %) are relayed by the Indian trade press citing the CEA, and cross-checked four independent ways in sources.md. Perimeters must not be mixed: the CEA counts utilities, Ember and Global Energy Monitor also count industrial captive plants, some twenty GW more.
The text of the post
In two years, India has added 11 gigawatts of coal power plants. But with the 68 gigawatts of solar added alongside, its coal generation has not moved. Critics of renewables will no doubt conclude that developing renewables means developing coal. Let us look at the details.
Indian electricity demand rose by 109 terawatt-hours in two years, or 6 %. That increase was covered entirely by low-carbon sources: solar, wind, hydro and nuclear. Coal-fired generation fell by 14 TWh, despite the new capacity.
So solar is not closing plants. It is taking away their operating hours. India’s coal fleet keeps growing while its output stalls.
You can see it in the load factor of coal plants: 69.1 % in 2023-24, 65.2 % in 2025-26. The fleet grew by 5 %, its output fell by 1 %. This is not India building too fast, as it did in 2012-2017; it is that demand growth no longer goes to coal but to solar, wind and hydro: new capacity, but also more favourable winds and rains.
This small beginning sets off a loop that could be virtuous in Europe but is less obvious in India, because power there does not go much through a short-term market like ours. Coal power is bought under long-term contracts, a kind of 25-year “feed-in tariff”, so a falling load factor, which in Europe would mean falling revenue and closure, means higher tariffs for end consumers there. Note that India’s dispatchable capacity, 309 GW, is barely above peak demand, 271 GW in May 2026, but Indian sunshine varies less across the seasons than in Europe (latitudes from 8 to 37°!) and India now awards almost no solar without storage: at the end of 2025, of 4.6 GW of projects awarded in one quarter, 4.5 GW came with storage. The government acknowledges that distribution companies no longer want “plain” solar: 69 GW of projects awarded, 24 GW of contracts signed. The latest auction produced a solar-plus-battery project (with an imposed delivery profile) at €48/MWh.
Sources: Central Electricity Authority, MNRE, Carbon Brief / CREA, Ember, SECI, JMK Research. Data, code and figures on my website.
Sources
- Carbon Brief / CREA, Analysis: India’s power-sector emissions flat for two years due to clean-energy surge, 17 septembre 2026
- Central Electricity Authority, Growth of Electricity Sector in India from 1947-2025 — Table 2 (capacité), Table 3 (production), Chart 13 (facteur de charge)
- Central Electricity Authority, Growth of Electricity Sector in India from 1947-2017 — les exercices 2012-13 à 2016-17
- Central Electricity Authority, Executive Summary on Power Sector, March-2026 — capacité au 31.03.2026 et production thermique de l’exercice
- Power Line, Coal Remains Key, 4 septembre 2026 — facteur de charge et production 2025-26, cités de la CEA
- Ember, Coal power to get costlier (Coal’s diminishing role in India’s electricity transition), 29 octobre 2025, révisé le 13 avril 2026
- Ember, Yearly and Monthly Electricity Data (CC BY 4.0) — contrôle de cohérence en années civiles
- PIB, ministère de l’Énergie, réponse écrite au Rajya Sabha, 9 février 2026 — tarifs du charbon neuf (TBCB) et du FDRE
- Central Electricity Authority, Executive Summary on Power Sector, March-2025 — production par source de 2023-24 et 2024-25, capacités au 31.03.2025
- Central Electricity Authority, Installed Capacity Report au 31.03.2026 — dont le retrait temporaire de 4,4 GW de gaz et 2 GW de charbon au 31.05.2025
- SECI, résultat de l’appel d’offres FDRE-RTC-V (1 000 MW), enchère du 6 août 2026 — 5,25 et 5,26 ₹/kWh, prix fixe sur 25 ans
- PIB (MNRE), 3 février 2026 — 69 GW attribués, 24,3 GW de contrats signés ; la demande de solaire « nu » baisse
- JMK Research, Q4 2025 India RE Update, mars 2026 — 4,5 GW sur 4,6 GW attribués avec stockage
- BCE, cours de référence EUR/INR — moyenne de septembre 2026 : 109,914
Data
donnees_inde_plf_cea.csv— The load factor of coal and lignite plants as published by the CEA, 1985-86 to 2025-26 (the last point is provisional). This is the left-hand curve.donnees_inde_mix_cea.csv— Installed capacity on 31 March 2024, 2025 and 2026, and gross generation in fiscal years 2023-24, 2024-25 and 2025-26, by source (CEA). These are the two waterfalls; the file header gives the groupings and the May 2025 accounting removal.donnees_inde_cout_charbon_ember.csv— The two-part tariff (fixed charge, energy charge) of the existing coal fleet and of a new plant, in rupees per kWh at an 85 % load factor, from Ember. This is the right-hand curve, converted to €/MWh at the ECB rate for September 2026.donnees_inde_charbon_cea.csv— Coal and lignite capacity, generation and load factor, 2011-12 to 2025-26 (CEA), for the detailed figure of the fleet and its output.donnees_inde_charbon_ember.csv— Consistency check in calendar years, wider perimeter (Ember, captive plants included).
Code
To reproduce the figure:
python3 build_planche.py           # la planche du post, les deux langues
python3 build_figure.py            # figure détaillée : capacité, production, facteur de charge
python3 build_cascade.py           # figure détaillée : cascades par source, 2023-24 → 2025-26
python3 build_cout.py              # figure détaillée : coût selon le facteur de charge
The panel imports the three scripts of the detailed figures and adds no computation. The cost curve is a formula with no fitted parameter: energy charge + fixed charge × 85 / load factor. The waterfall checks that its steps add up to the total published by the CEA.
All files of this post (figures, data, scripts) are in the folder 2026-10-02-charbon-inde-facteur-de-charge of the public repository.
Code under the MIT licence; texts and figures under CC BY 4.0; data remain under their producer’s licence.