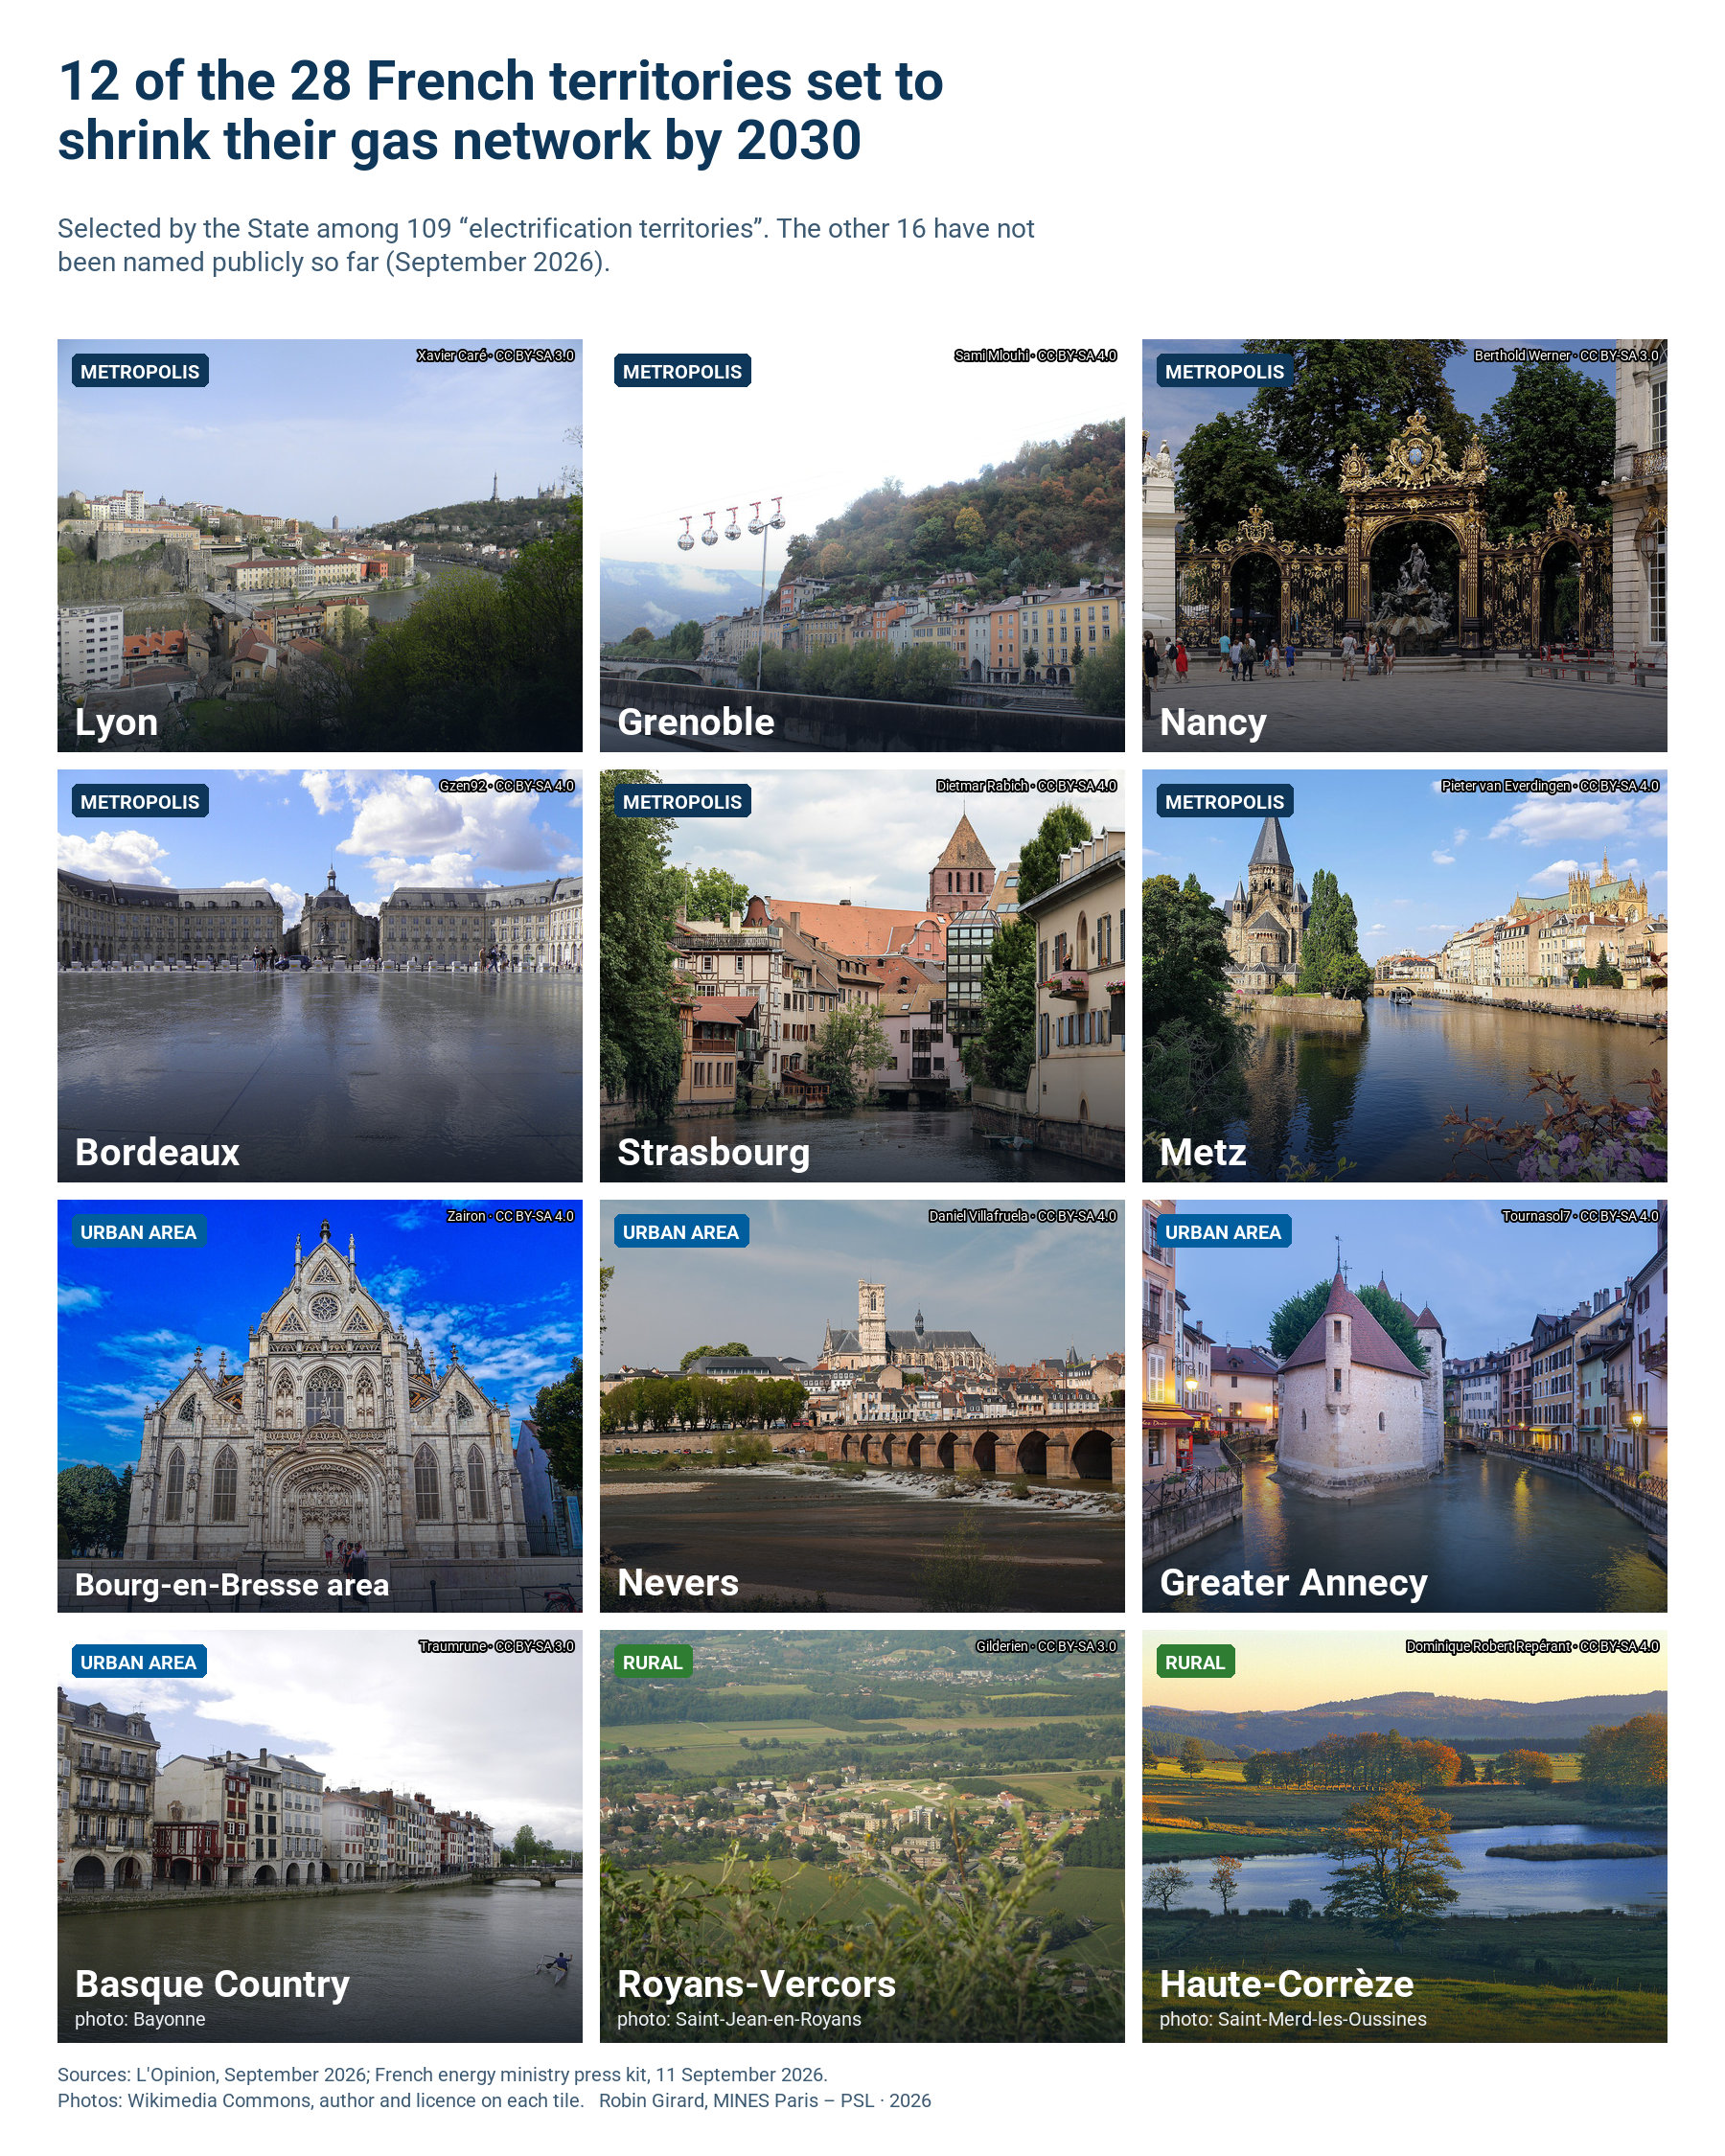
The photos in the figure keep their original licence (CC BY-SA 3.0 or 4.0, author printed on each tile); the mosaic is therefore released under CC BY-SA 4.0, not CC BY 4.0.
The text of the post
The French State has just selected 28 territories, out of 109 examined, to shrink their gas distribution network by 2030. Six metropolitan areas, mid-sized urban areas, and rural territories such as Royans-Vercors and Haute-Corrèze.
It is a good initiative! Gas consumption is set to fall by about 70 % by 2050 under France’s national low-carbon strategy (SNBC 3), and a network costs roughly the same whether a lot or a few molecules flow through it. Consumers today pay nearly 7 billion euros a year for gas infrastructure, more than half of it for distribution alone. When volumes leave and costs stay, the bill falls on those who remain. This is not a projection: the distribution tariff of GRDF, the main distribution operator, rose by 27.5 % in July 2024, more than half of it because of lower-than-expected revenues and falling consumption. In Grenoble, whose network has its own operator, that tariff was still 186 % of GRDF’s until June 2026, before a single national tariff spread this extra cost over all customers.
Why it is hard. Closing a pocket of gas network is not a gas decision. It is a trade-off between three infrastructures: the electricity network, the gas network and the heat network. What gas no longer does, electricity or biomass has to do — and the electricity distribution network is taking on electric vehicles and solar PV, and is already fragile at the winter peak. In an extreme cold spell, electric heating, which equips about 40 % of homes, can draw up to 45 GW on its own, nearly half of the French peak. The value of the gas network lies partly in the electricity reinforcement it avoids. And that avoided reinforcement is not worth the same in a 1970s housing estate as in a rural village centre.
In other words, the right question is not “where is gas declining?” but “where does the full cost of the three networks fall if we close?”. It has a second half, sometimes forgotten: the cost of electricity reinforcement is not a given, it depends on the flexibility we are able to mobilise. Controlling EV charging and heat pumps can tip the trade-off one way or the other.
No one in France has computed this at a fine spatial scale, and we have developed the tools to do it, notably in the FlexVal project, for which we are recruiting today. The 28 territories will therefore have to work through, by 2030, a question for which we are actively developing the tools. Open-source tools!
Sources in the comments.
Sources
- L’Opinion, Electrification : les 28 territoires choisis par l’Etat pour — vraiment — sortir du gaz, septembre 2026 (article payant)
- Post LinkedIn de Jade Grandin de l’Éprevier, septembre 2026
- CRE, Avenir des infrastructures gazières à 2050, 1er juillet 2026 (consommation 2025, SNBC 3, charges de réseau)
- CRE, délibération n° 2024-40 du 15 février 2024, tarif ATRD7 de GRDF (+27,5 % au 1er juillet 2024)
- CRE, délibération n° 2025-140 du 11 juin 2025, tarif de GreenAlp (Grenoble) au 1er juillet 2025, JORF n° 0145 du 24 juin 2025
- CRE, délibération n° 2026-83 du 16 avril 2026, mise en œuvre de la péréquation nationale des tarifs de distribution de gaz
- RTE-ADEME, Réduction des émissions de CO2, impact sur le système électrique : quelle contribution du chauffage dans les bâtiments à l’horizon 2035 ?, décembre 2020
- RTE, Futurs énergétiques 2050, rapport complet, 2022
- Photos de la figure : Wikimedia Commons (auteurs et licences dans photos.json et sur chaque vignette)
Code
The script build_figure.py produces the figure on its own.
To reproduce the figure:
python3 build_figure.py                     # deux formats, deux langues
python3 build_figure.py --format portrait --lang fr
The script computes nothing and reads no data file: it downloads twelve freely licensed photos from Wikimedia Commons, checks their licence, prints author and licence on each tile and assembles the mosaic. Each photo’s provenance is in photos.json.
All files of this post (figures, data, scripts) are in the folder 2026-09-24-sortie-du-gaz-28-territoires of the public repository.
Code under the MIT licence; texts and figures under CC BY 4.0; data remain under their producer’s licence.