Summary – In a previous article [PostEnergySieves], Yassine Abdelouadoud and I presented the French energy performance certificate (EPC) and discussed its use for assessing the number of energy sieves — the worst-insulated dwellings — in France. We proposed a new estimate of around 7 million sieves, quite different from the official estimate [SDES-Sept2020] of 4.5 million. The plausibility of these results was supported by an analysis of the evolution since the previous 2013 assessment, which counted 8 million sieves and was the consensus figure. The new estimate we propose was obtained with a new method, which we present briefly in this article and which makes it possible, among other things, to correct certain flaws of the EPC database. One possible application of the results obtained with the methodology presented in this post is a map of the estimated location of energy sieves in France. Note that green does not mean there are no buildings to renovate. The whole of France is concerned, and local authorities will have work to do. From 2025 it will no longer be possible to let a class G dwelling.
Availability of the results. The full description of the method is available, and the text below is a summary of it. The complete detailed results at the scale of the stock are available under the Open Licence on data.gouv.fr. The share and number of energy sieves per IRIS district are available under the Open Licence on data.gouv.fr. The complete data (that is, the census dwelling-detail file enriched with energy performance data) are made available under the Open Licence (licence text).
Introduction: the limits of the EPC database
The EPC database published online by ADEME, used in [SDES-Sept2020] but also in our analysis [PostEnergySieves], contains all the EPCs carried out since the regulatory obligation came into force. Although very rich, it does not allow the energy performance of the residential stock to be estimated directly, for two reasons.
- The presence of flaws linked to how the EPCs are produced: (a) manipulation of the input data by assessors when the result of the assessment is close to a class boundary, (b) use of the bill-based method, which has an intrinsic bias, and (c) massive recourse to default values for post-1974 buildings, which leads to an over-estimation of energy performance.
- The sample of dwellings on which EPCs are carried out is not representative (for instance, new dwellings are over-represented), because of the conditions under which an EPC is mandatory (putting a dwelling up for sale or for rent).
The second limitation is circumvented in [SDES-Sept2020] by using the Fidéli database [Fidéli2021], which is not accessible to everyone; and the first limitation is only circumvented for the problem caused by the bill-based method, through the use of the Enerter model of the company Energie Demain. On our side, we have developed a two-step methodology, detailed in the following sections:
- Cleaning the EPC database and correcting the production-related flaws mentioned above.
- Matching with the census dwelling-detail file to correct the non-representativeness of the sample.
Cleaning and correcting the EPC database
Before presenting the three flaws (a, b, c) listed in the introduction and the associated correction methods, a few preliminary points are needed. First, some EPCs cannot be used, because of inconsistencies in the input data or because they do not concern the residential stock; these are removed (about 5,122,000 EPCs are kept). Next, the main EPC results can be extracted directly from the database, but some characteristics have to be computed from the relevant tables of the [description of the former EPC]. Finally, so that each of the analyses and corrections given below is applied to sub-samples that are as homogeneous as possible, the EPCs are grouped by construction-year class, calculation method, dwelling type and heating fuel. In each of the following sub-sections we give graphical representations, some of them concerning a subset of the sample. The full set of analyses and a more detailed description of the adjustment methods are available in the full report.
Manipulation of input data by assessors near class boundaries
The flaw that is easiest to demonstrate is the over-representation of primary energy consumption values close to the upper bounds of an energy class, together with the symmetric under-representation close to the lower bounds; it can be seen in the graph of Figure 1.
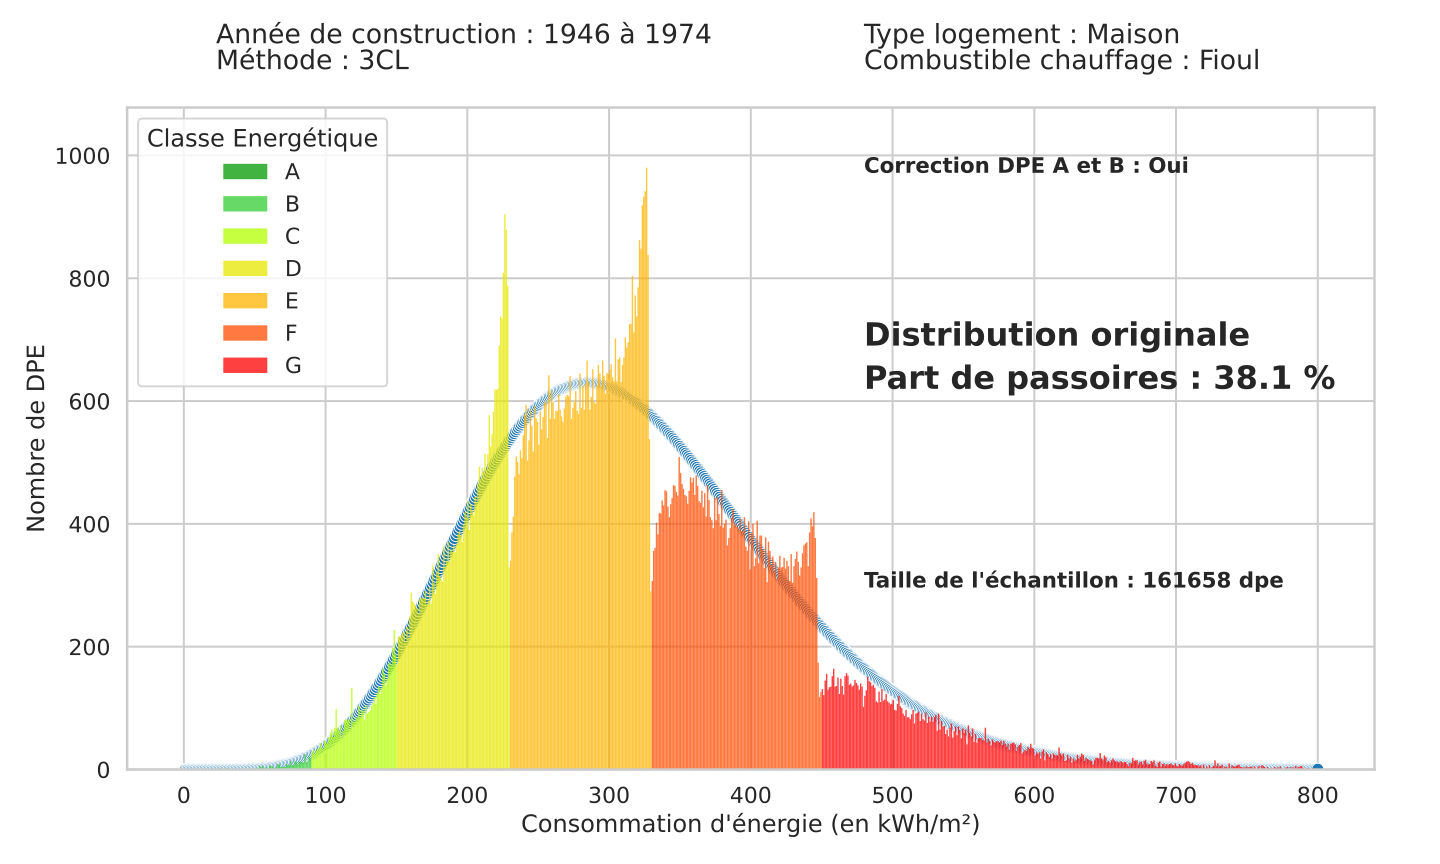
Figure 1 – Distribution of primary energy consumption obtained with the 3CL method for single-family houses heated with fuel oil, built between 1946 and 1974. The blue line is a beta distribution approximating the envelope of the observed distribution.
The correction applied relies on the maximum-likelihood beta distribution (in blue in the graph above). That distribution is used to identify the over-represented and under-represented consumption intervals and to move part of the EPCs from the former to the latter so as to minimise the gap with the beta distribution. The result obtained for the sample above is given in the graph of Figure 2.
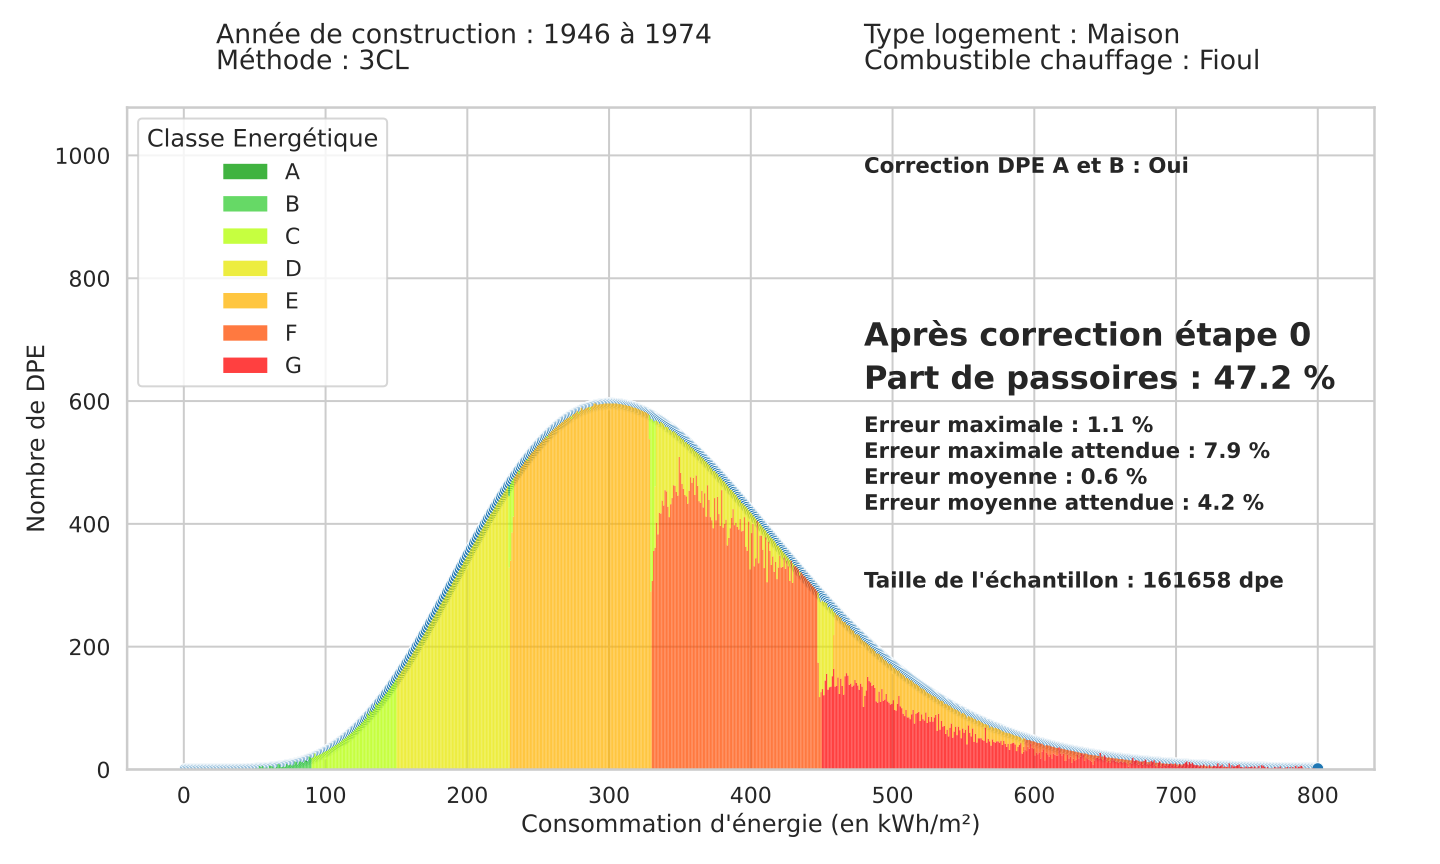
Figure 2 – Distribution of primary energy consumption after correction, for single-family houses heated with fuel oil built between 1946 and 1974
Use of the bill-based method
By construction, the bill-based method assesses the combination of the intrinsic performance of the dwelling and the energy behaviour of its occupants, over a perimeter that includes — in the case of electricity in particular — consumption not accounted for by the 3CL method. If the occupants experience energy poverty (5 million households according to the ONPE), they will tend to reduce their energy consumption (heating in particular) to limit their bill, all the more so as their dwelling performs poorly. That translates into a significant transfer from classes E, F and G towards classes B, C and D, clearly visible in Figure 3, produced for dwellings built between 1940 and 1950.
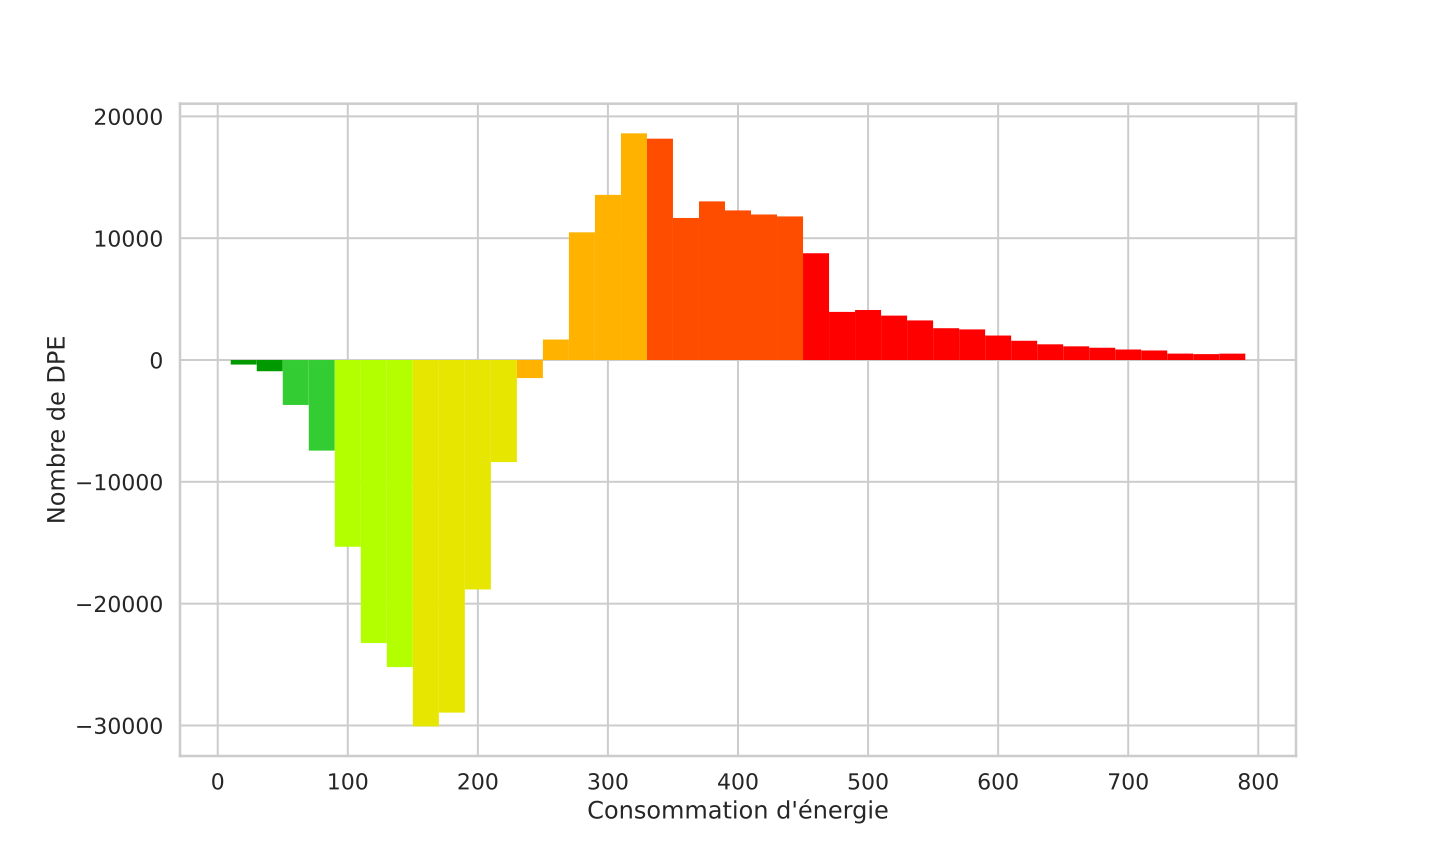
Figure 3 – Difference, over the sub-sample of dwellings built between 1940 and 1950, between the distribution of energy consumption for 3CL EPCs and that for bill-based EPCs; a positive value therefore indicates more 3CL EPCs
This limitation of the bill-based method is compensated by applying a correction factor to the parameters of the underlying beta distribution. The correction factors are estimated for each fuel and dwelling type by comparing samples of bill-based and 3CL EPCs corresponding to similar construction periods.
Default values over-estimating performance
When the 3CL method is applied, some input parameter values may be assigned as a function of the construction year if the assessor judges that measuring them is impossible. That practice rests on the entry into force of successive thermal regulations (RT 1974, 1982, 1988, 2000, 2005) imposing ever more demanding performance levels on buildings. However, the default values, set independently for each element (wall, floor, etc.), are only limited approximations of the regulatory requirements, which have been based, since 1974, on global performance criteria taking into account in particular the areas of the various envelope elements relative to the floor area. Since each thermal regulation was associated with an explicit performance improvement requirement (except RT 1988, see below), in Figure 4 we compare the evolution of that requirement with the evolution of the default values.
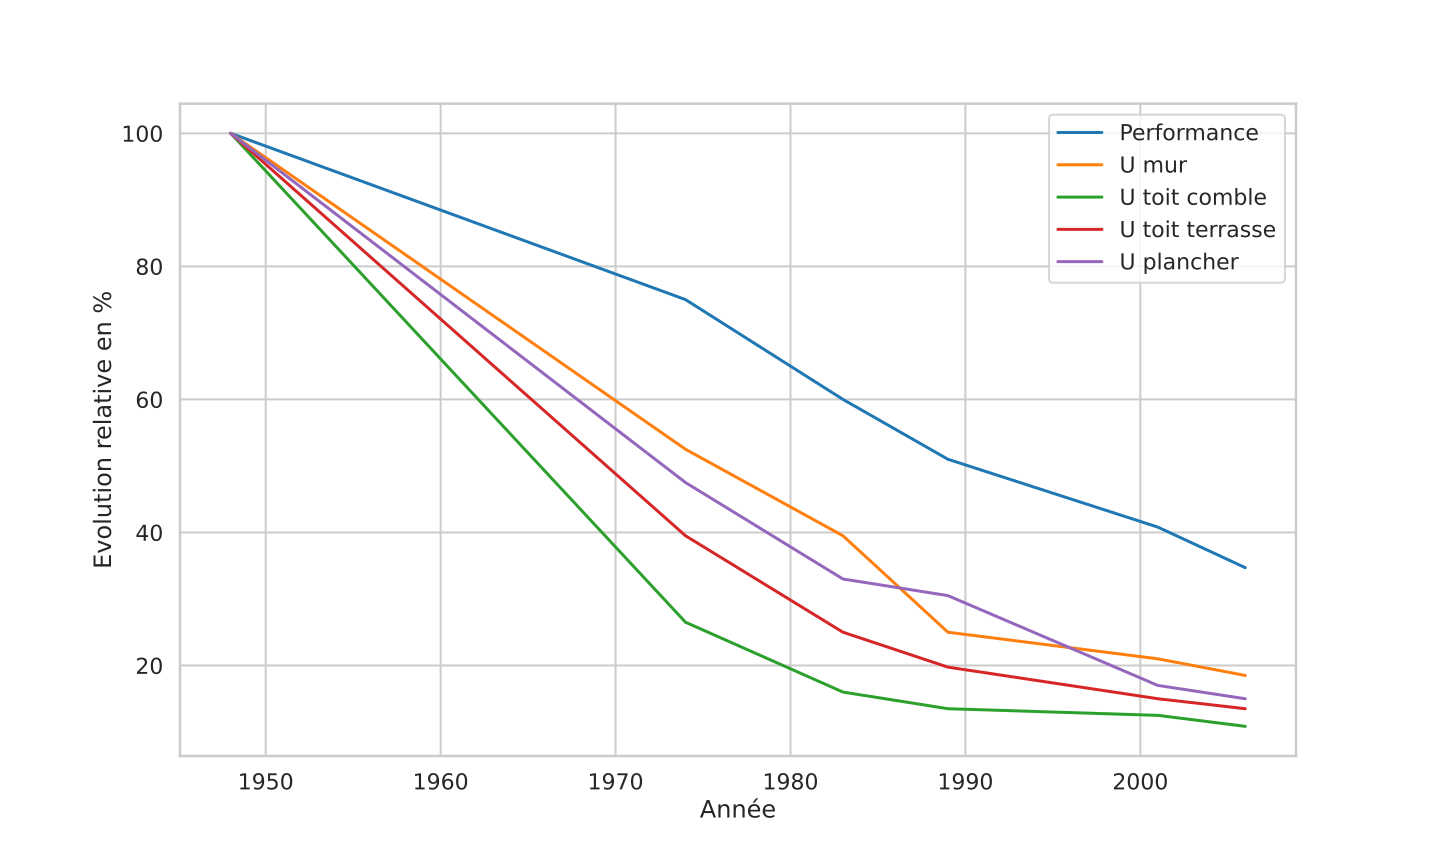
Figure 4 – comparison of the evolution, as a function of construction year, of building performance associated with the thermal regulations (blue line) with that associated with the default values in the 3CL EPC (all colours except blue).
One can see that the default values initially fall faster than the performance requirement, with the gap being partly caught up from the thermal regulations of the 2000s onwards, which implies an over-estimation of performance when default values are applied to all the envelope elements of a dwelling. That advantage translates into a very significant increase in the use of default values for construction periods between 1975 and 2012 (between 65 and 75% of EPCs for which default values were used on all envelope elements), as can be seen in Figure 5.
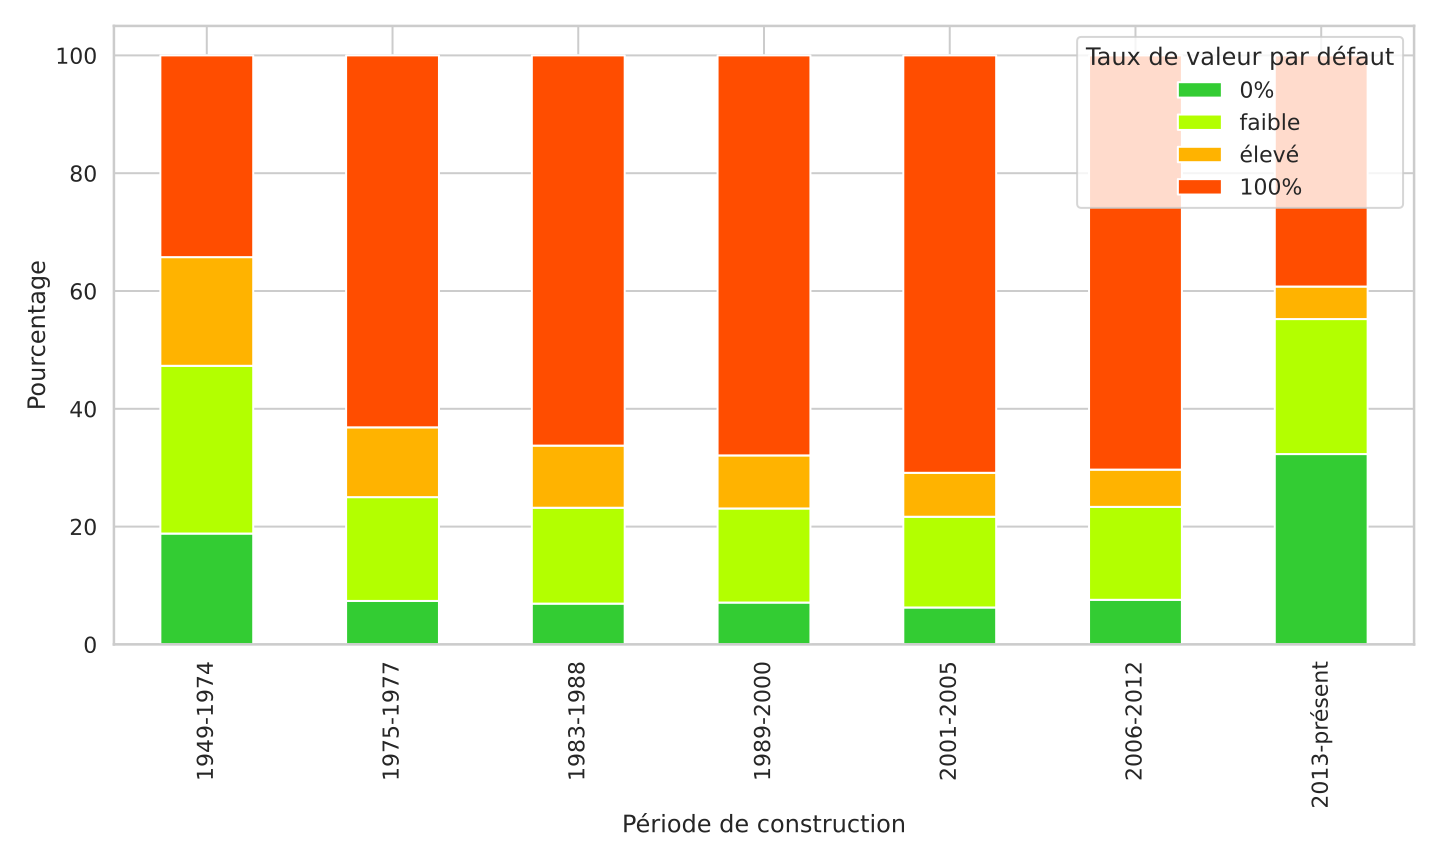
Figure 5 – Evolution of the use of default values by assessors, as a function of the construction period of the buildings.
The impact of using the 3CL default values for construction periods between 1975 and 2012 is compensated by applying a correction factor to the parameters of the underlying beta distribution. The correction factors are estimated for each fuel, dwelling type and construction period by comparing samples of EPCs with a low rate of default values against samples with a high rate of default values.
Matching with the dwelling-detail file
Selection biases are corrected by matching the EPC database with the dwelling-detail file of the INSEE census — an exhaustive description of the housing stock geolocated at IRIS level and containing, in particular, variables that are decisive for characterising dwellings energetically and that are common with the EPC database.
- Dwelling type (single-family house or flat)
- Construction-year class
- Floor-area class
- Main heating fuel (electricity, gas, fuel oil or other)
Matching consists in assigning to each record of the dwelling-detail file an EPC with similar characteristics on the attributes above. Because of the very uneven geographical distribution of the EPCs carried out, it is not possible to find a matching EPC for each record of the dwelling-detail file within the same IRIS. To get around that limitation, matching is performed at several successive geographical scales: IRIS, municipality, inter-municipal authority (EPCI), department, region, country. The graph of Figure 6 shows the number of census records matched at each geographical level.
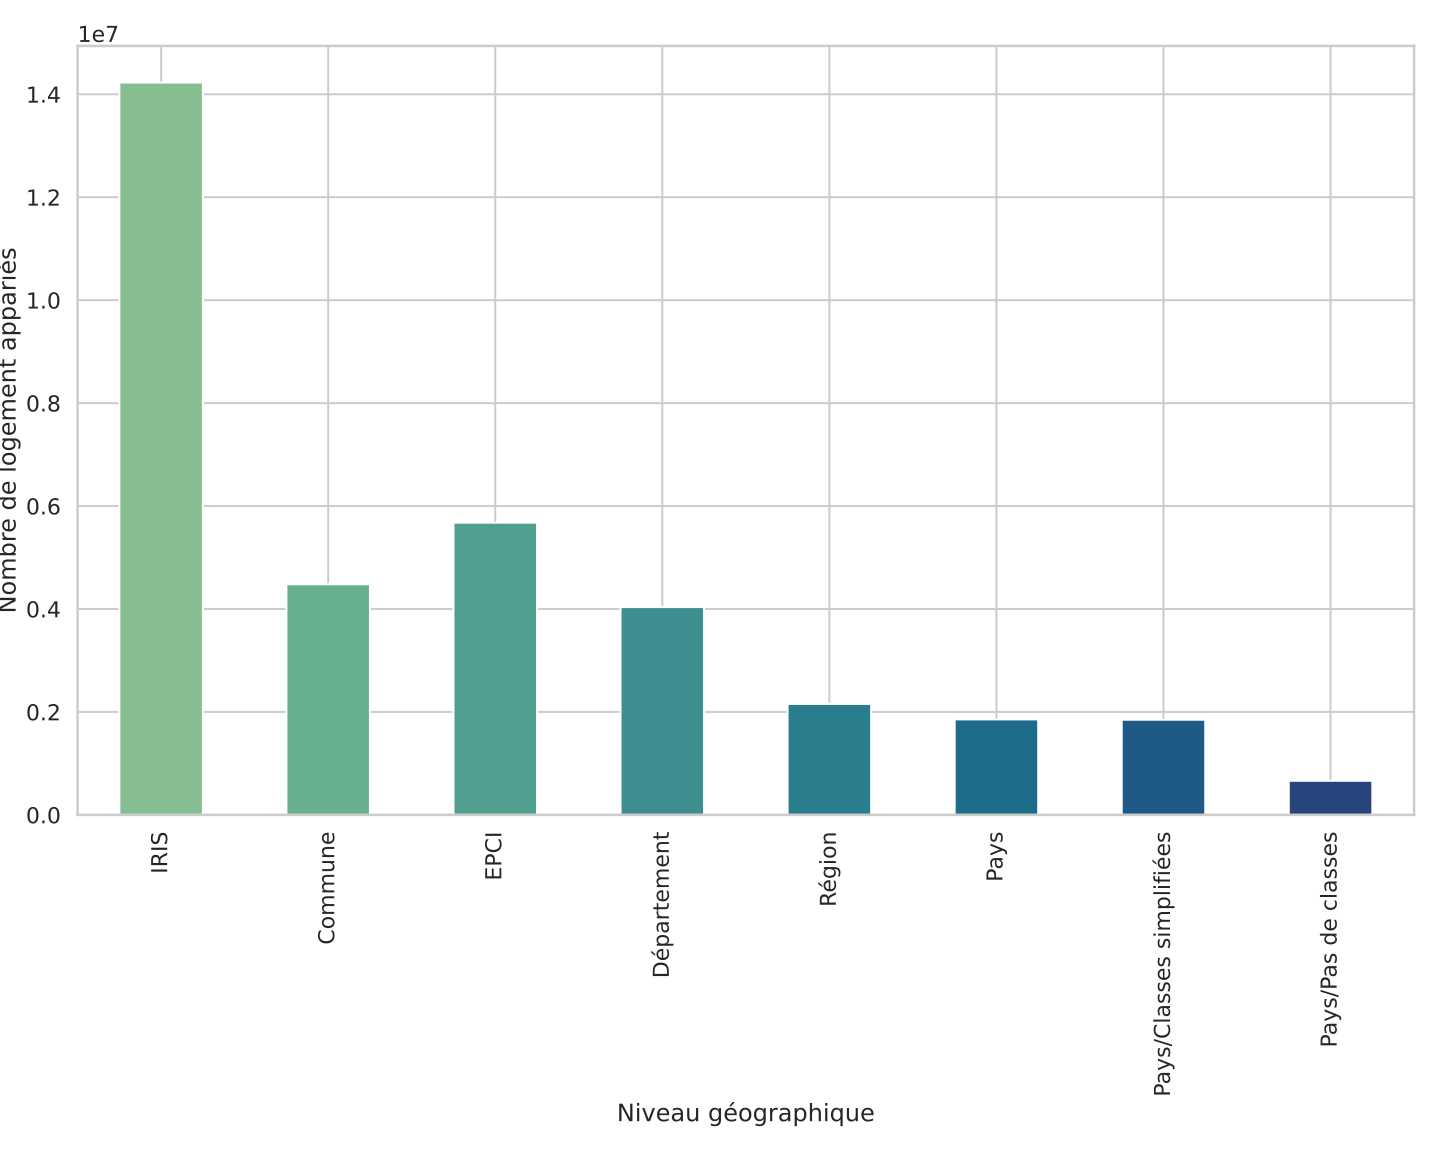
Figure 6 – Number of census records matched at each geographical level
Results
Comparing the impacts of census matching and EPC correction
To illustrate the impact of correcting the EPC database and of matching with the census, we show in Figure 7 the total number of main residences by energy class for three types of calculation:
- Direct extrapolation of the raw EPC database (i.e. a rule of three applied to the number of dwellings)
- Matching with the census from the raw EPC database
- Matching with the census from the corrected EPC database
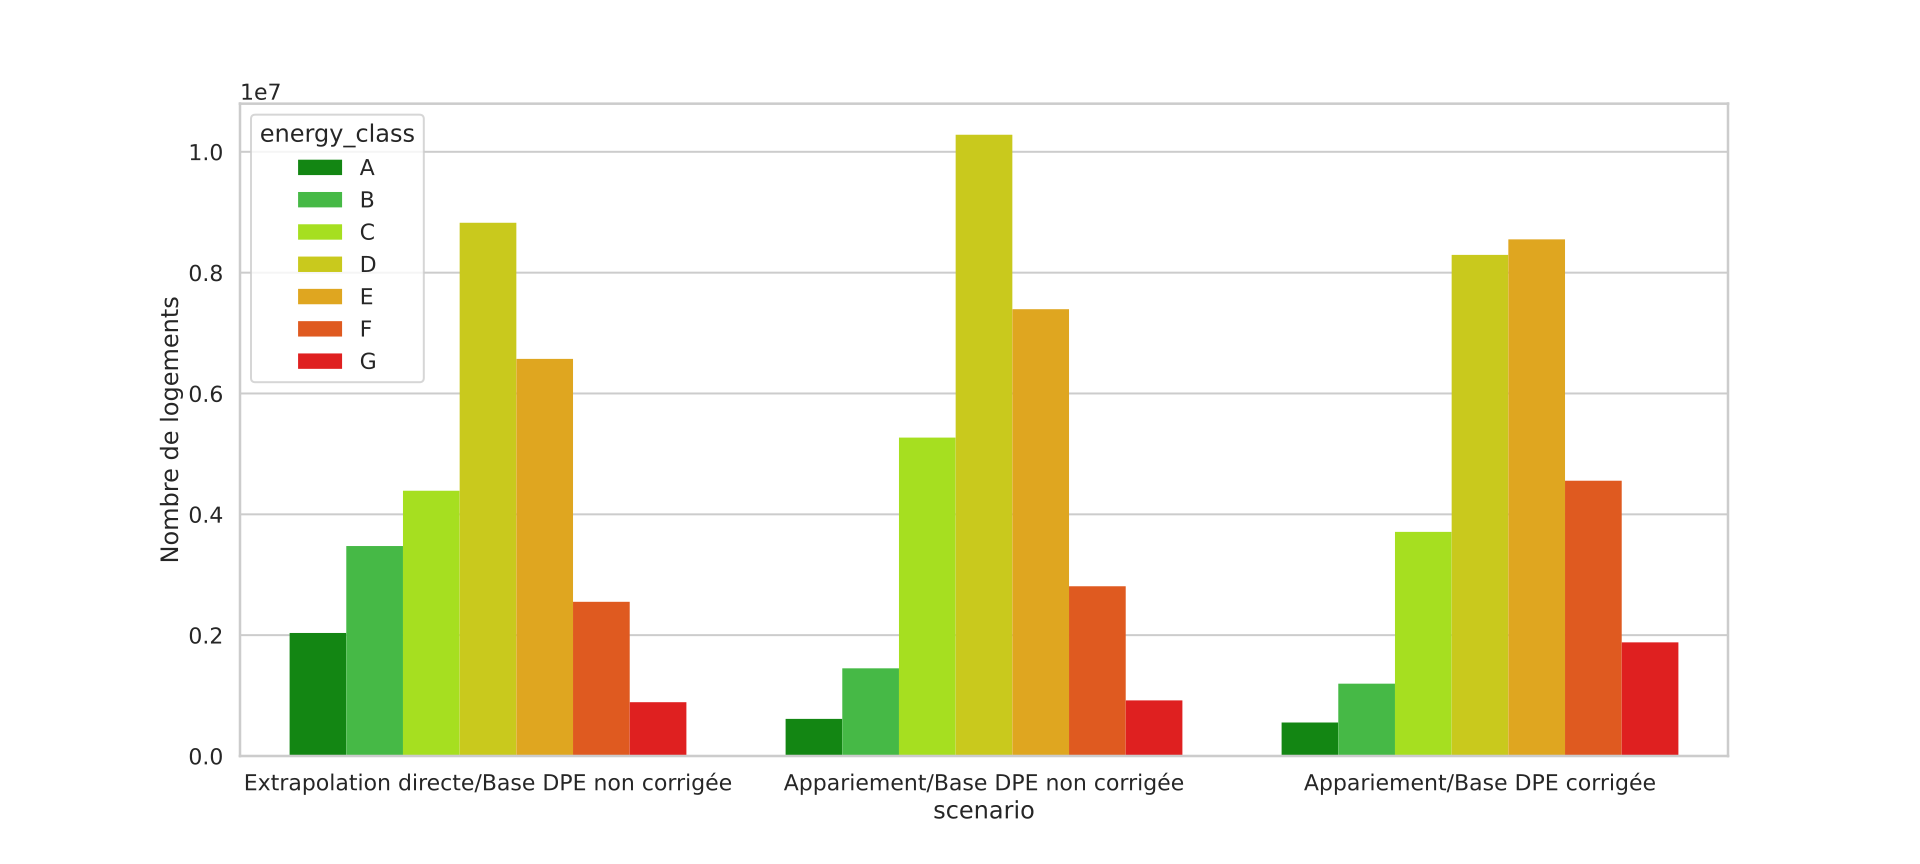
Figure 7 – Total number of main residences by energy class for the three types of calculation.
One can see that the main consequence of matching with the census, at the scale of the stock, is to reduce the over-representation of new dwellings, which make up the majority of the very high-performing dwellings (A and B). Correcting the EPC database, for its part, has the effect of increasing the share of poorly performing dwellings (E, F and G).
Sensitivity to the correction factors
The correction factors used were obtained by comparing sub-samples of the EPC database and are therefore only approximations of the phenomena to be modelled. To illustrate the sensitivity of the results to these factors, we carry out a sensitivity study consisting in varying the “bill” and “3CL” factors separately, in 10% increments between 50 and 200% of their initial value. The graph below shows the number of energy sieves (main residences in classes F and G) for each of the scenarios:
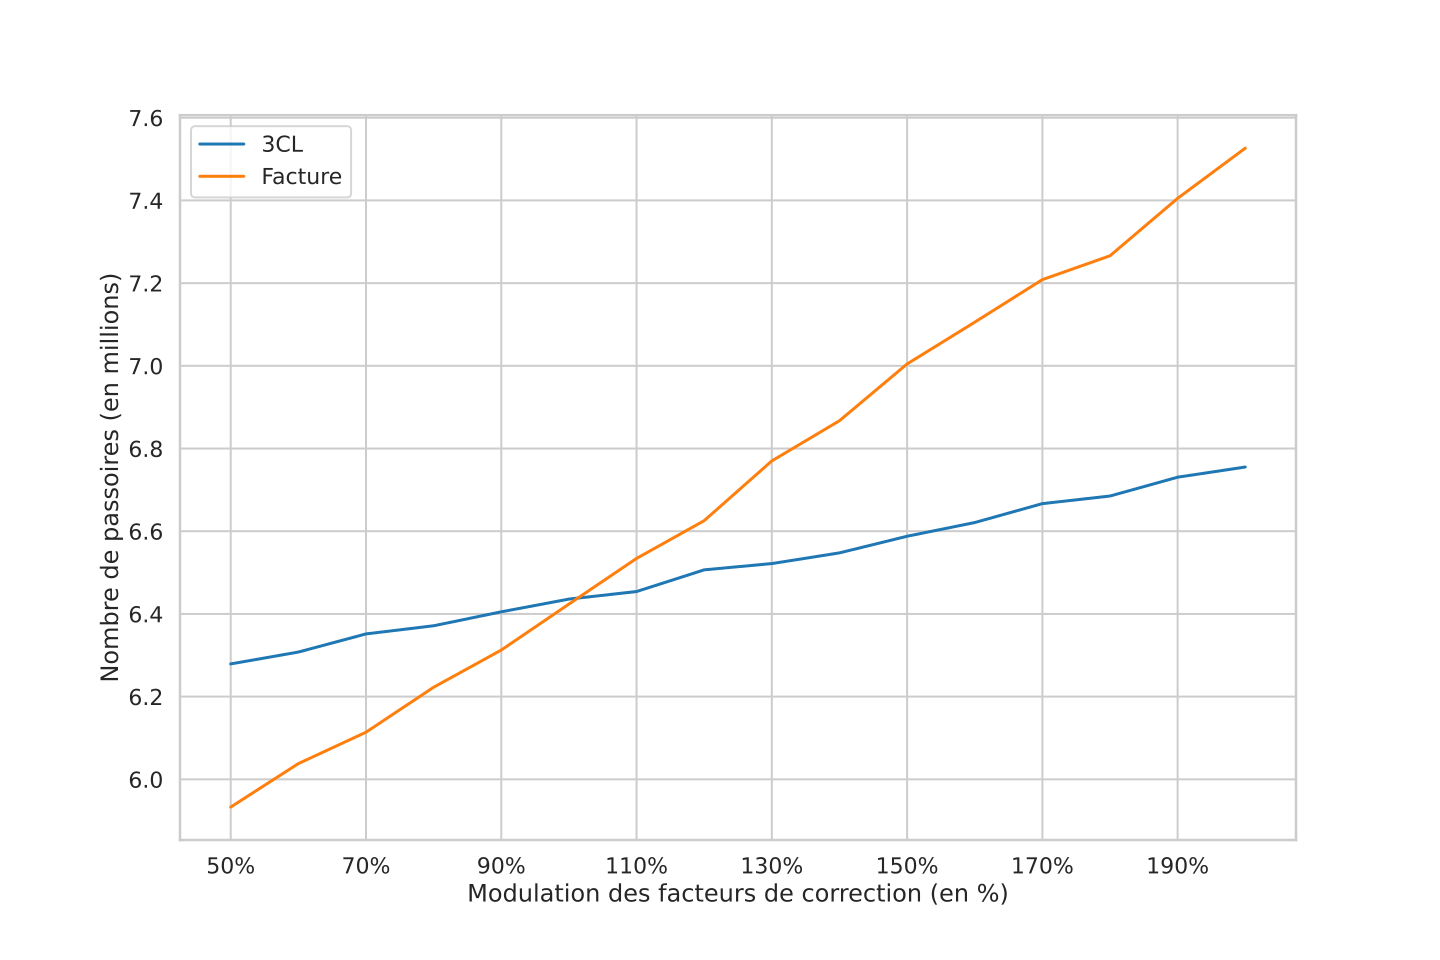
Figure 8 – Sensitivity of the number of energy sieves to the correction applied to the beta distribution.
As regards the correction factors of the bill-based method, we have an external calibration point: the number of energy sieves among dwellings built before 1948 obtained in the SDES study of September 2020, for which the bill-based EPCs were replaced by the Enerter model of Energies Demain (about 2.6 million). That value corresponds to a 160% modulation of the bill-method correction factors, leading to a total of 6.9 million energy sieves, which we take as the reference in what follows.
Detailed results
By construction, the methodology makes it possible to produce results at the scale of the stock by dwelling class, as illustrated below:
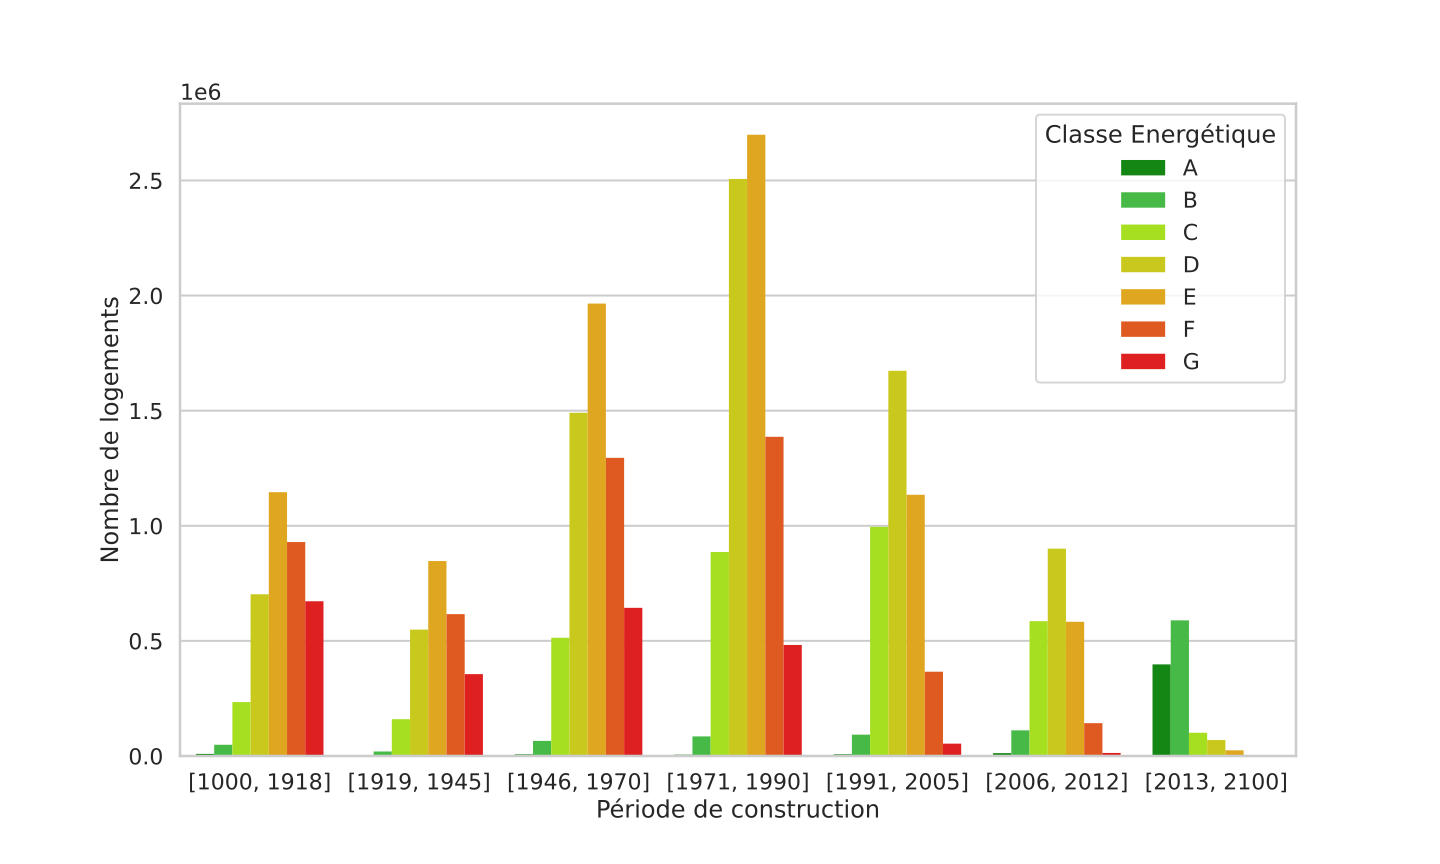
Figure 9-a – Number of dwellings by energy class and by construction-year class
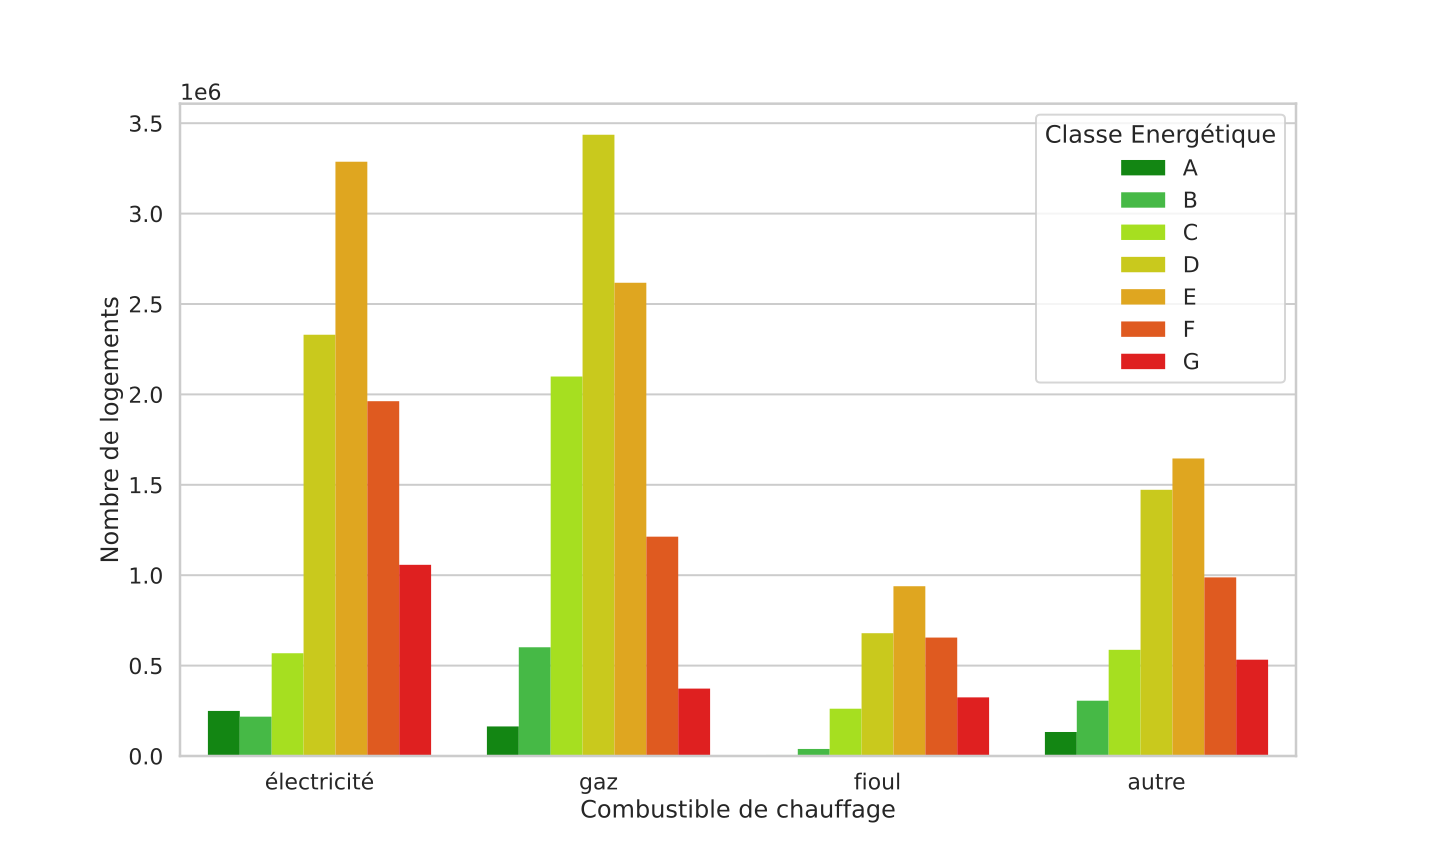
Figure 9-b – Number of dwellings by energy class and by heating fuel
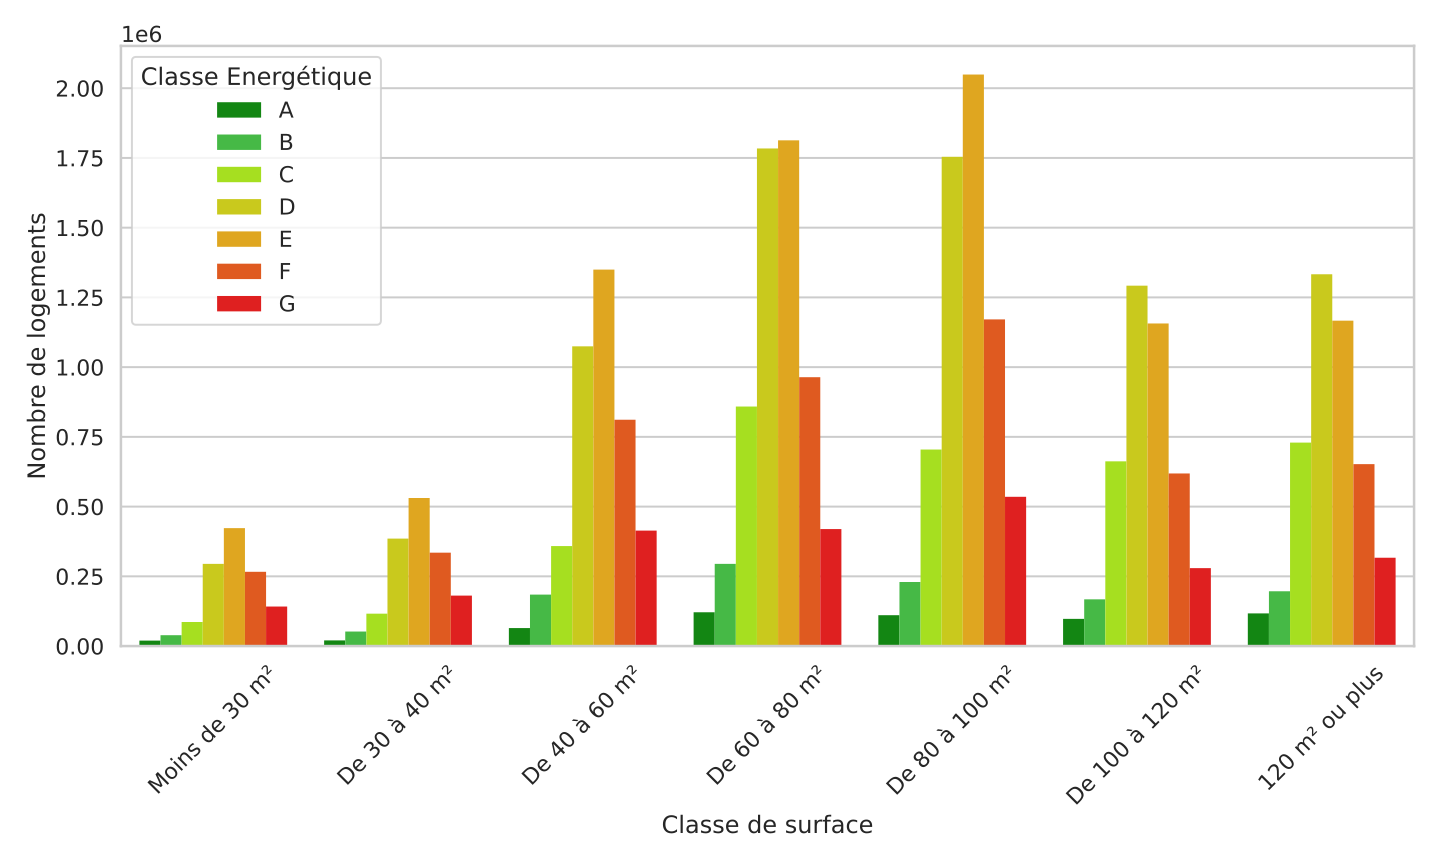
Figure 9-c – Number of dwellings by energy class and floor-area class
Availability of the results. The full description of the method is available, and the text above is a summary of it. The complete detailed results at the scale of the stock are available under the Open Licence on data.gouv.fr. The share and number of energy sieves per IRIS district are available under the Open Licence on data.gouv.fr. The complete data (that is, the census dwelling-detail file enriched with energy performance data) are made available under the Open Licence (licence text).
Outlook
The existence of a broad consensus among energy renovation stakeholders on the state of the stock is a prerequisite for designing and implementing a renovation policy commensurate with what is at stake. However, publishing raw data such as ADEME’s EPC database as open data is not sufficient to establish such a consensus, because of the non-reproducibility and relative opacity of the processing methods used by the various actors.
One way out of this deadlock is to set up an open source initiative (computation code + documented methodology) for estimating the performance of the stock, under a collegial governance associating the various stakeholders. In order to foster the emergence of such a structure, we propose to use the methodology presented here and the associated code as an initial building block.