Summary – In this article, co-written with Yassine Abdelouadoud, we discuss the role of the French energy performance certificate (DPE, “diagnostic de performance énergétique”) in the energy transition, and in particular the estimates it has made possible of the number of energy sieves — the worst-insulated dwellings. We seek to explain the origin of the differences between two estimates produced by the government: the 2013 one (8.8 million) and the 2020 one (4.8 million). Part of that difference is explained by the dynamics of the housing stock (demolitions/renovations), but we show that it is mostly a set of flaws in the EPC database used in 2020 that causes it, and we propose a method to correct those flaws which leads to an estimate of 7 million energy sieves. We discuss the importance of these figures with respect to our medium- and long-term objectives in the context of the energy transition.
The EPC, a key instrument of energy policy.
In the building sector, the transition to carbon neutrality will run through building renovation as much as through changes in heating systems. According to the second version of the French national low-carbon strategy [SNBC2]: “in the residential sector, the renovation rate reaches around 370,000 equivalent complete renovations on average over the period 2015-2030, then increases to around 700,000 equivalent complete renovations on average over the period 2030-2050.”
This strategy will be updated shortly, but one can already note that the stated ambition is high and that its implementation will be complex. Complex because the number of buildings is large; complex because renovation is difficult to standardise; complex because the building stock is very heterogeneous in terms of performance and typology; difficult because it will reach into people’s private living space. It is therefore important to move forward with an instrument that makes it possible to measure the state of the stock at any time, and to set long-term objectives together with a realistic and monitorable trajectory to reach them — and to communicate clear objectives, known to all, well in advance.
That instrument already partly exists: the energy performance certificate (EPC), which assigns a given dwelling an estimate of its heating requirement and of its energy consumption for domestic hot water and cooking. In its most synthetic form it boils down to a label between A and G, which also gives a clear definition of what an “energy sieve” is: a building with an F or G label. These labels make it possible to define energy policies. In the short term, the climate and resilience law [LoiResilienceClimat-juillet2021] will freeze the rents of energy sieves from 2023, and ban the letting of poorly insulated dwellings: label G from 2025, F in 2028 and E in 2034. Over time, the EPC will therefore play the role of a roadworthiness test for the energy performance of a building.
This certificate can be seen as a tool for sampling one building of the stock. Since the EPC is now mandatory when a building is let or sold, it is in effect an observation method applied at large scale, which makes it possible to form a picture of the performance of the whole stock — all the more so as all the data collected in these EPCs, which are numerous for each building, are made available as open data [baseDPE2021].
Note at this stage that the EPC combines simple on-site measurements, a few default values (more or fewer depending on the practices of the assessors), and the use of a model, the “3CL”. It gives an estimate of a conventional consumption reflecting the performance of the building fabric under an average climate for its location. It must not be confused with actual consumption, which additionally reflects how the building is occupied and the year-to-year variability of the climate. Moreover, actual consumption can depend quite strongly — especially for poorly performing buildings — on the conditions of use (occupancy rate, heating set point, ventilation, etc.), and the EPC tool is not designed to quantify the behaviour of consumers experiencing energy poverty.
Existing methods for assessing the number of energy sieves, and the flaws of the EPC
Two estimates of the performance of the French stock as a whole have been published by the statistical services of the CGDD from a set of EPCs. The first [SDES2012] was produced in 2013 on the 2012 stock, from 2400 EPCs carried out by Bureau Veritas as part of the Phébus survey [Phebus]. The second was produced in 2020 [SDES-Sept2020] from a sample of the EPCs carried out under the legal obligation for dwellings built after 1948 [baseDPE2021], and using Energie Demain’s Enerter model for older buildings.
In all these cases, to obtain a number of buildings in each energy class at the scale of France, a statistical reweighting of the EPC database is required, using an exhaustive or representative description of the stock based on variables present in the EPC: the type and age of the building and the climate zone in which it is located. Indeed, the EPCs do not come from a sampling design that would allow the distribution of performance across all buildings in France to be deduced directly — for example, new buildings are over-represented because since 2012 an EPC has been mandatory at construction. In the first method, the statistical reweighting was carried out using the 2011 population census [RecensementINSEE]; in the second, it was carried out using Fidéli [Fidéli2021].
These two methodologies led to significant discrepancies in the estimated number of energy sieves: 8.8 million and 4.9 million respectively. These differences may have several origins: (1) the dynamics of the stock (renovation/demolition) between the two periods analysed: (2011-2012) for the first and (2016-2018) for the second. That could explain barely more than a difference of the order of 1,000,000 sieves. (2) the difference between the census used in the first case and the Fidéli database in the second, to infer the performance of the whole stock from the retained sample. Here a difference of about 500,000 sieves can be explained. (3) the use of two EPC campaigns carried out under different conditions and with different objectives. We will show that the largest difference comes from this.
The technical details supporting our claims for the quantification of points 1 and 2 are given in the Appendix. We will therefore give more detail on the third point: the difference between the 2400 Phébus survey EPCs used in the 2013 assessment and the EPCs carried out under the regulatory obligation, used in the 2020 study. The former were produced homogeneously by a single organisation (Bureau Veritas), which was paid to take the time to do the job properly, avoiding for instance the excessive use of default values. The client (the State), for its part, had no interest in obtaining an energy class reflecting a well-performing dwelling. Conversely, the EPCs in the database used in the 2020 study are far more numerous but were commissioned by private individuals, who have an interest in the energy class being that of a well-performing dwelling. They were produced by a large number of consultancies, some of which may have wanted to save time by using default values, or even to please the client by adjusting the observations made on site. The distribution of performance from this second EPC database is shown in Figure 1. It does not capture all the distortions induced by the problems just mentioned, but it clearly reflects the fact that a significant number of cheaters had scruples and wanted to place the EPC result among the least performing of the class. Note also that assessors’ use of default values certainly caused some under-estimations of performance too, particularly for recent buildings.
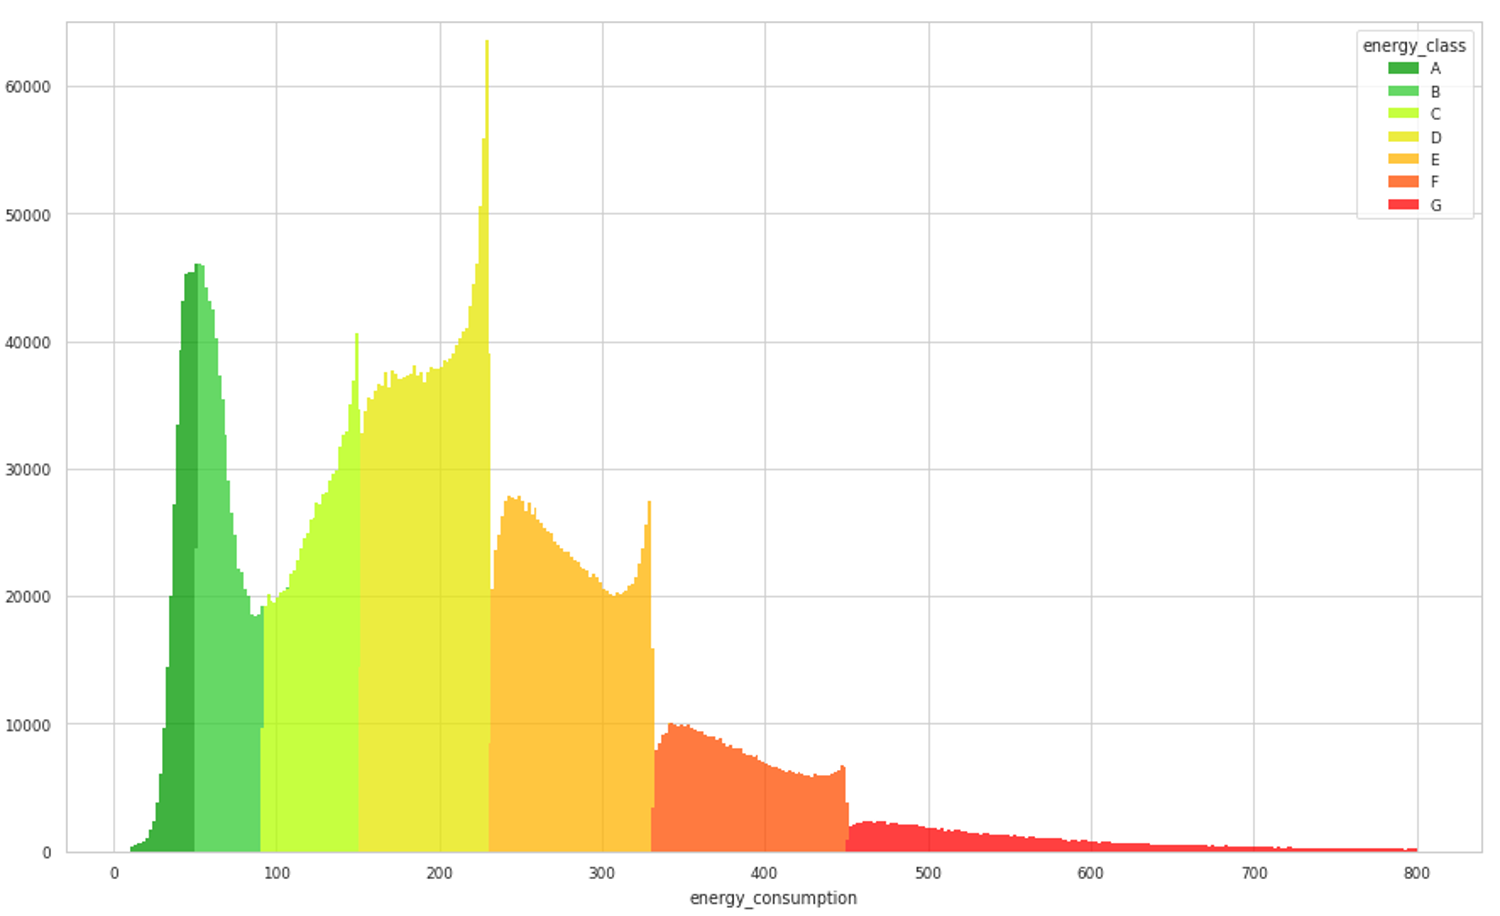
Figure 1 – Distribution of simulated energy consumption for the sample of 5.2 million EPCs in the database [baseDPE2021] used in the 2020 study [SDES-Sept2020].
There is another substantive point on which the two campaigns differ significantly: the treatment of buildings constructed before 1948. Even though it is not the cause of a difference in the results between the two studies (see the table in the next section), it is worth mentioning here. Until last July, when the EPC method was changed, buildings constructed before 1948 were assessed through an EPC based on the analysis of energy bills rather than on the application of the 3CL method. That so-called “bill” method did not measure conventional consumption and, in the case of energy sieves occupied by people who cannot afford high consumption, these bill-based EPCs greatly over-estimated the performance of the buildings. In addition, a number of buildings with construction dates close to 1948 very likely cheated on the date in order to be eligible for a bill-based EPC. That is why the SDES turned to the Enerter model of the company Energie Demain. The descriptions of that model show that the energy poverty phenomenon mentioned above is taken into account. We also observe that the results of this model on pre-1948 buildings are consistent with the data from the Phébus survey (see the table in the next section).
We do not advocate a return to the Phébus database, which is too old and too small to characterise properly the tail of the performance distribution in the French building stock. A regular update and enrichment of Phébus could be a relatively cheap avenue given the sums that will have to be committed to this transition, but we believe it is possible to reuse the [SDES-Sept2020] method while correcting the problems intrinsic to EPCs produced under the legal obligation.
Our correction of the EPC database
We have proposed a method to correct the flaws mentioned in the previous section that are present in the EPC database used in the 2020 study. Recall that the [SDES-Sept2020] analysis relies on Fidéli, whereas we used the INSEE census, which is easier to obtain. The difference between these two databases is discussed in the appendix.
We are not able for the moment to detect fraud or an abusive use of default values on any particular EPC, but we can correct the distribution of energy performance so as to remove the peaks and fill in the troughs that appear at the class boundaries from class D onwards. More generally, we have developed a method that corrects the performance distribution. This correction is carried out age band by age band. The resulting distribution, aggregated over all EPCs, is given in the following figure. We will shortly publish a full report describing the methodology; to find out more, you can contact directly Yassine Abdelouadoud (yassine@abckpi.com), who implemented the methodology and is carrying out the detailed study.
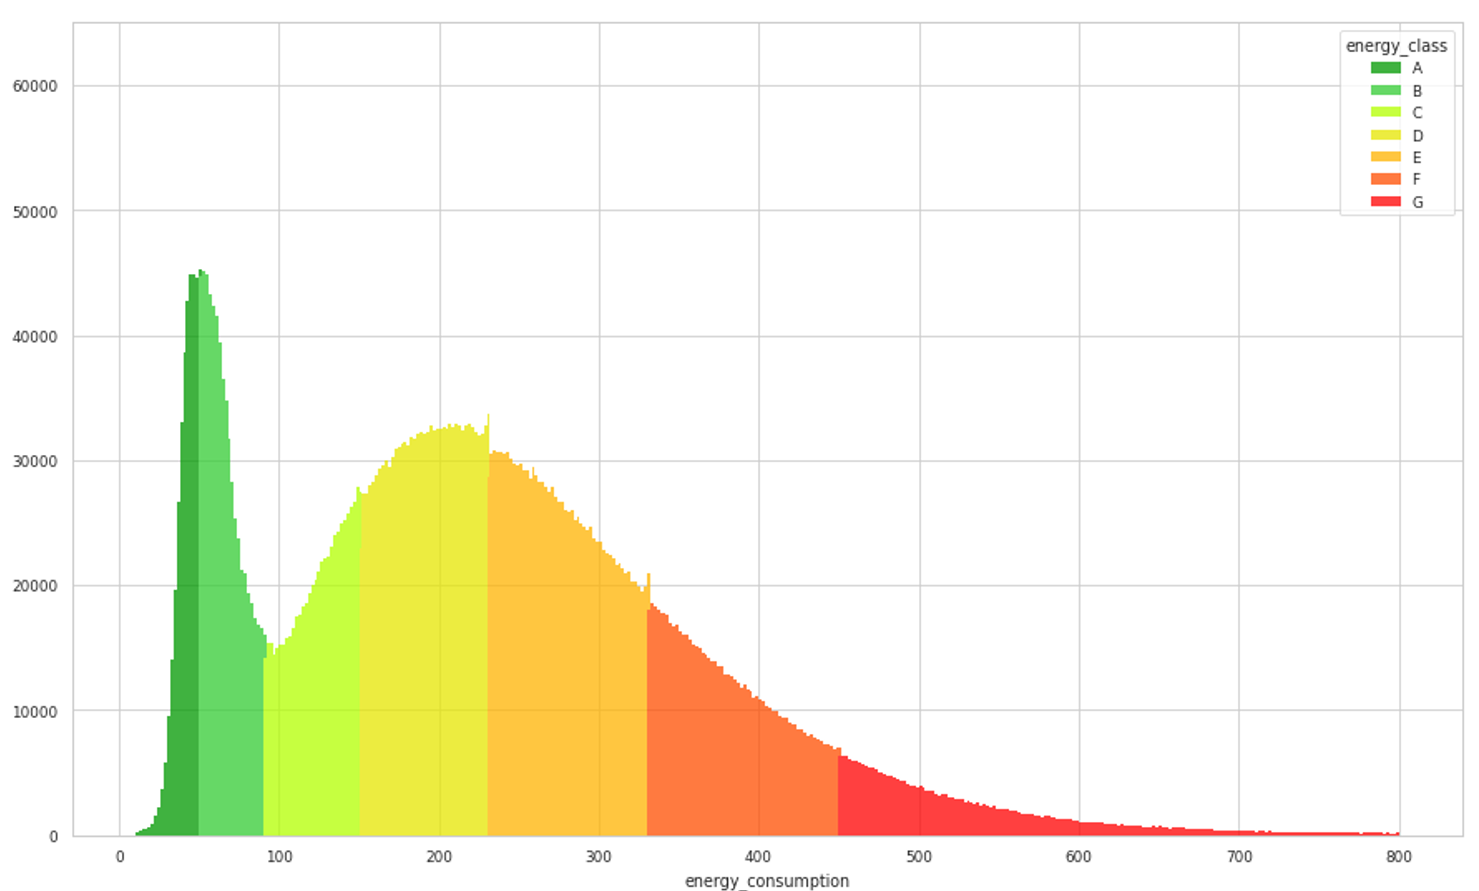
Figure 2 – Distribution of all the EPCs of [baseDPE2021] after correction of the flaws.
| Flaw correction | Bill correction | <1918 | [1919,1945] | [1946,1970] | [1971,1990] | [1991,2005] | >2006 | |
|---|---|---|---|---|---|---|---|---|
| “Raw” EPC | 18.68 | 18.77 | 18.67 | 12.49 | 3.58 | 1.03 | ||
| SDES 2020 | X | 42.4 | 35.8 | 16.8 | 12.6 | 3.8 | 1.16 | |
| our correction | X | X | 41.45 | 40.96 | 35.72 | 24.18 | 5.6 | 1.33 |
Table 1 – Share of energy sieves (classes F and G) by age band in the [baseDPE2021] database, according to the type of corrections applied. Correcting for fraud has a decisive impact.
With this method for correcting the EPC database [baseDPE2021], we obtained about 7 million energy sieves.
On the new EPC and its update
A new version of the 3CL method was published in July 2021. It is a robust method that appears to satisfy the most demanding experts in the field [Sidler-Sept2021]. Moreover, this method allows pre-1948 buildings to be treated. The requirements on the software that assessors may use are stronger, and the EPC is now a legally binding document that a buyer could use to cancel a sale. It seems clear that the assessors’ past practices — whether the wish to work fast or the wish to please the client — will not find the same room. The first field feedback is far too sparse to constitute a reliable measurement, but the number of sieves reported did not agree with the [SDES-Sept2020] study and corresponds, as can be seen in Table 2, rather to our own assessment.
| SDES 2020 | Phébus | Field feedback 2021 | Our method | |
|---|---|---|---|---|
| Share of energy sieves | 27.5% | 42.5% | 38.6% | 38.2% |
Table 2: field feedback [Remonte2021] (see also [Sidler-Sept2021]) on the share of energy sieves among all buildings constructed before 1974. We have added the results of our method.
Note that the housing ministry, together with the DGEC, decided to make marginal changes to the EPC published in March 2021, through an order of October 2021 [DPE-MiseAjourOct2021]. It will be possible to judge the impact of that reform when the data from the new EPCs are made available by ADEME. The government announces minor impacts and marginal corrections, but at the same time this reform was put in place following, among other things, an over-representation of sieves in the 2021 field feedback that was incompatible with the 2020 estimate. The modified parameters include the air change rate, which can have a significant impact on the results. The explanation given by the government is that this modification will allow the “air renewal” parameter to be adapted to field observations (presence of seals on windows), but these air-permeability parameters do not correspond to a physical reality that is easy to measure and, given their impact, one will mostly note that these choices will have the effect of moving an uncertain number of dwellings up a class.
Conclusion: on the consequences of these errors.
With respect to the changes made to the new EPC in October 2021, two scenarios are possible: (1) the number of sieves falls but remains close to our estimate of 7 million; (2) the modification brings the number of sieves back to the estimate given in the 2020 study (5 million). It will be possible to know which of these trends reflects reality when the field feedback from the new EPC is made public by ADEME within a few months.
In the first scenario, the situation of September 2021 will repeat itself: the government and the building sector will realise that the number of sieves affected in the short term by the restrictions of the climate and resilience law [LoiResilienceClimat-juillet2021] is larger than that assumed in the 2020 study. The alternatives will be the same as in September 2021: revise upwards the resources allocated to energy renovation, or modify the EPC again by order. Choosing the second option once more will damage the credibility of the EPC and will certainly put our long-term objectives (carbon neutrality) out of reach. In the second scenario, the EPC will make it easier to reach the short-term objectives (eliminating the sieves) at the expense of the credibility of the EPC and of the long-term objectives, by pushing too large a share of renovations back to 2034. Moreover, in these cases the households directly affected will be those experiencing energy poverty in the private rented sector, who may see the renovation of their home postponed to 2034.
Beyond the technical questions relating to the EPC: who really knows the measures taken by the climate law? Has a letter been sent to every dwelling with an F or G EPC to inform them (the addresses are known and public in the EPC database)? To the mayors of the towns likely to host these dwellings? Or is everyone waiting alone for the fateful date to arrive, in order to complain about not having been warned and to ask for a bit more time? Measuring badly today means not allocating enough public money to support renovations, and preparing to accept either backtracking on the short- and long-term objectives or putting in difficulty owners in need who are today unaware of what awaits them.
Appendix: details on the impact of stock dynamics and renovations, and of the choice of the Fidéli database
We discuss here the factors that may justify the move from 8.8 million sieves in 2013 to the roughly 7 million we obtain with our method. 1 - the dynamics of the stock (renovation/demolition) between the two periods analysed: (2011-2012) for the first and (2016-2018) for the second. That could explain barely more than a difference of the order of 1,000,000 sieves. 2 - the difference between the census used in the first case and the Fidéli database in the second, to infer the performance of the whole stock from the retained sample. Here a difference of about 500,000 sieves can be explained.
Regarding point 1, demolition and renovation can be separated. According to the INSEE censuses [RecensementINSEE] carried out for the years between 2013 and 2017, building demolition represents about 150,000 dwellings per year (see Figure 1 below), i.e. about 750,000 dwellings between the 2012 stock and the 2018 stock. Among buildings constructed before 1918, 40% are energy sieves; assuming prudently that more than half of the 750,000 demolished dwellings were sieves gives 400,000 sieves demolished.
According to the TREMI survey [TREMI2017] carried out in 2017 over the period 2014-2016, 260,000 dwellings underwent a renovation allowing them to gain two energy classes or more, and 1,040,000 dwellings underwent a renovation allowing them to gain one energy class. It is very optimistic to think that all these buildings were originally energy sieves. Assuming that 600,000 sieves disappeared in this way seems reasonable to us.
Regarding point 2, a direct comparison between Fidéli and the census is not straightforward, because the two assessments are made on different segments. One can nevertheless observe that for pre-1945 buildings, the most likely to be sieves (since in that age band 40% are class F or G), the difference is about 500,000 dwellings. For dwellings built between 1945 and 2005 the difference is about 3 million dwellings. Applying the rates given in [SDES-Sept2020], one can imagine that across all these buildings the difference between Fidéli and the census accounts for an under-estimation of about 500,000 dwellings.