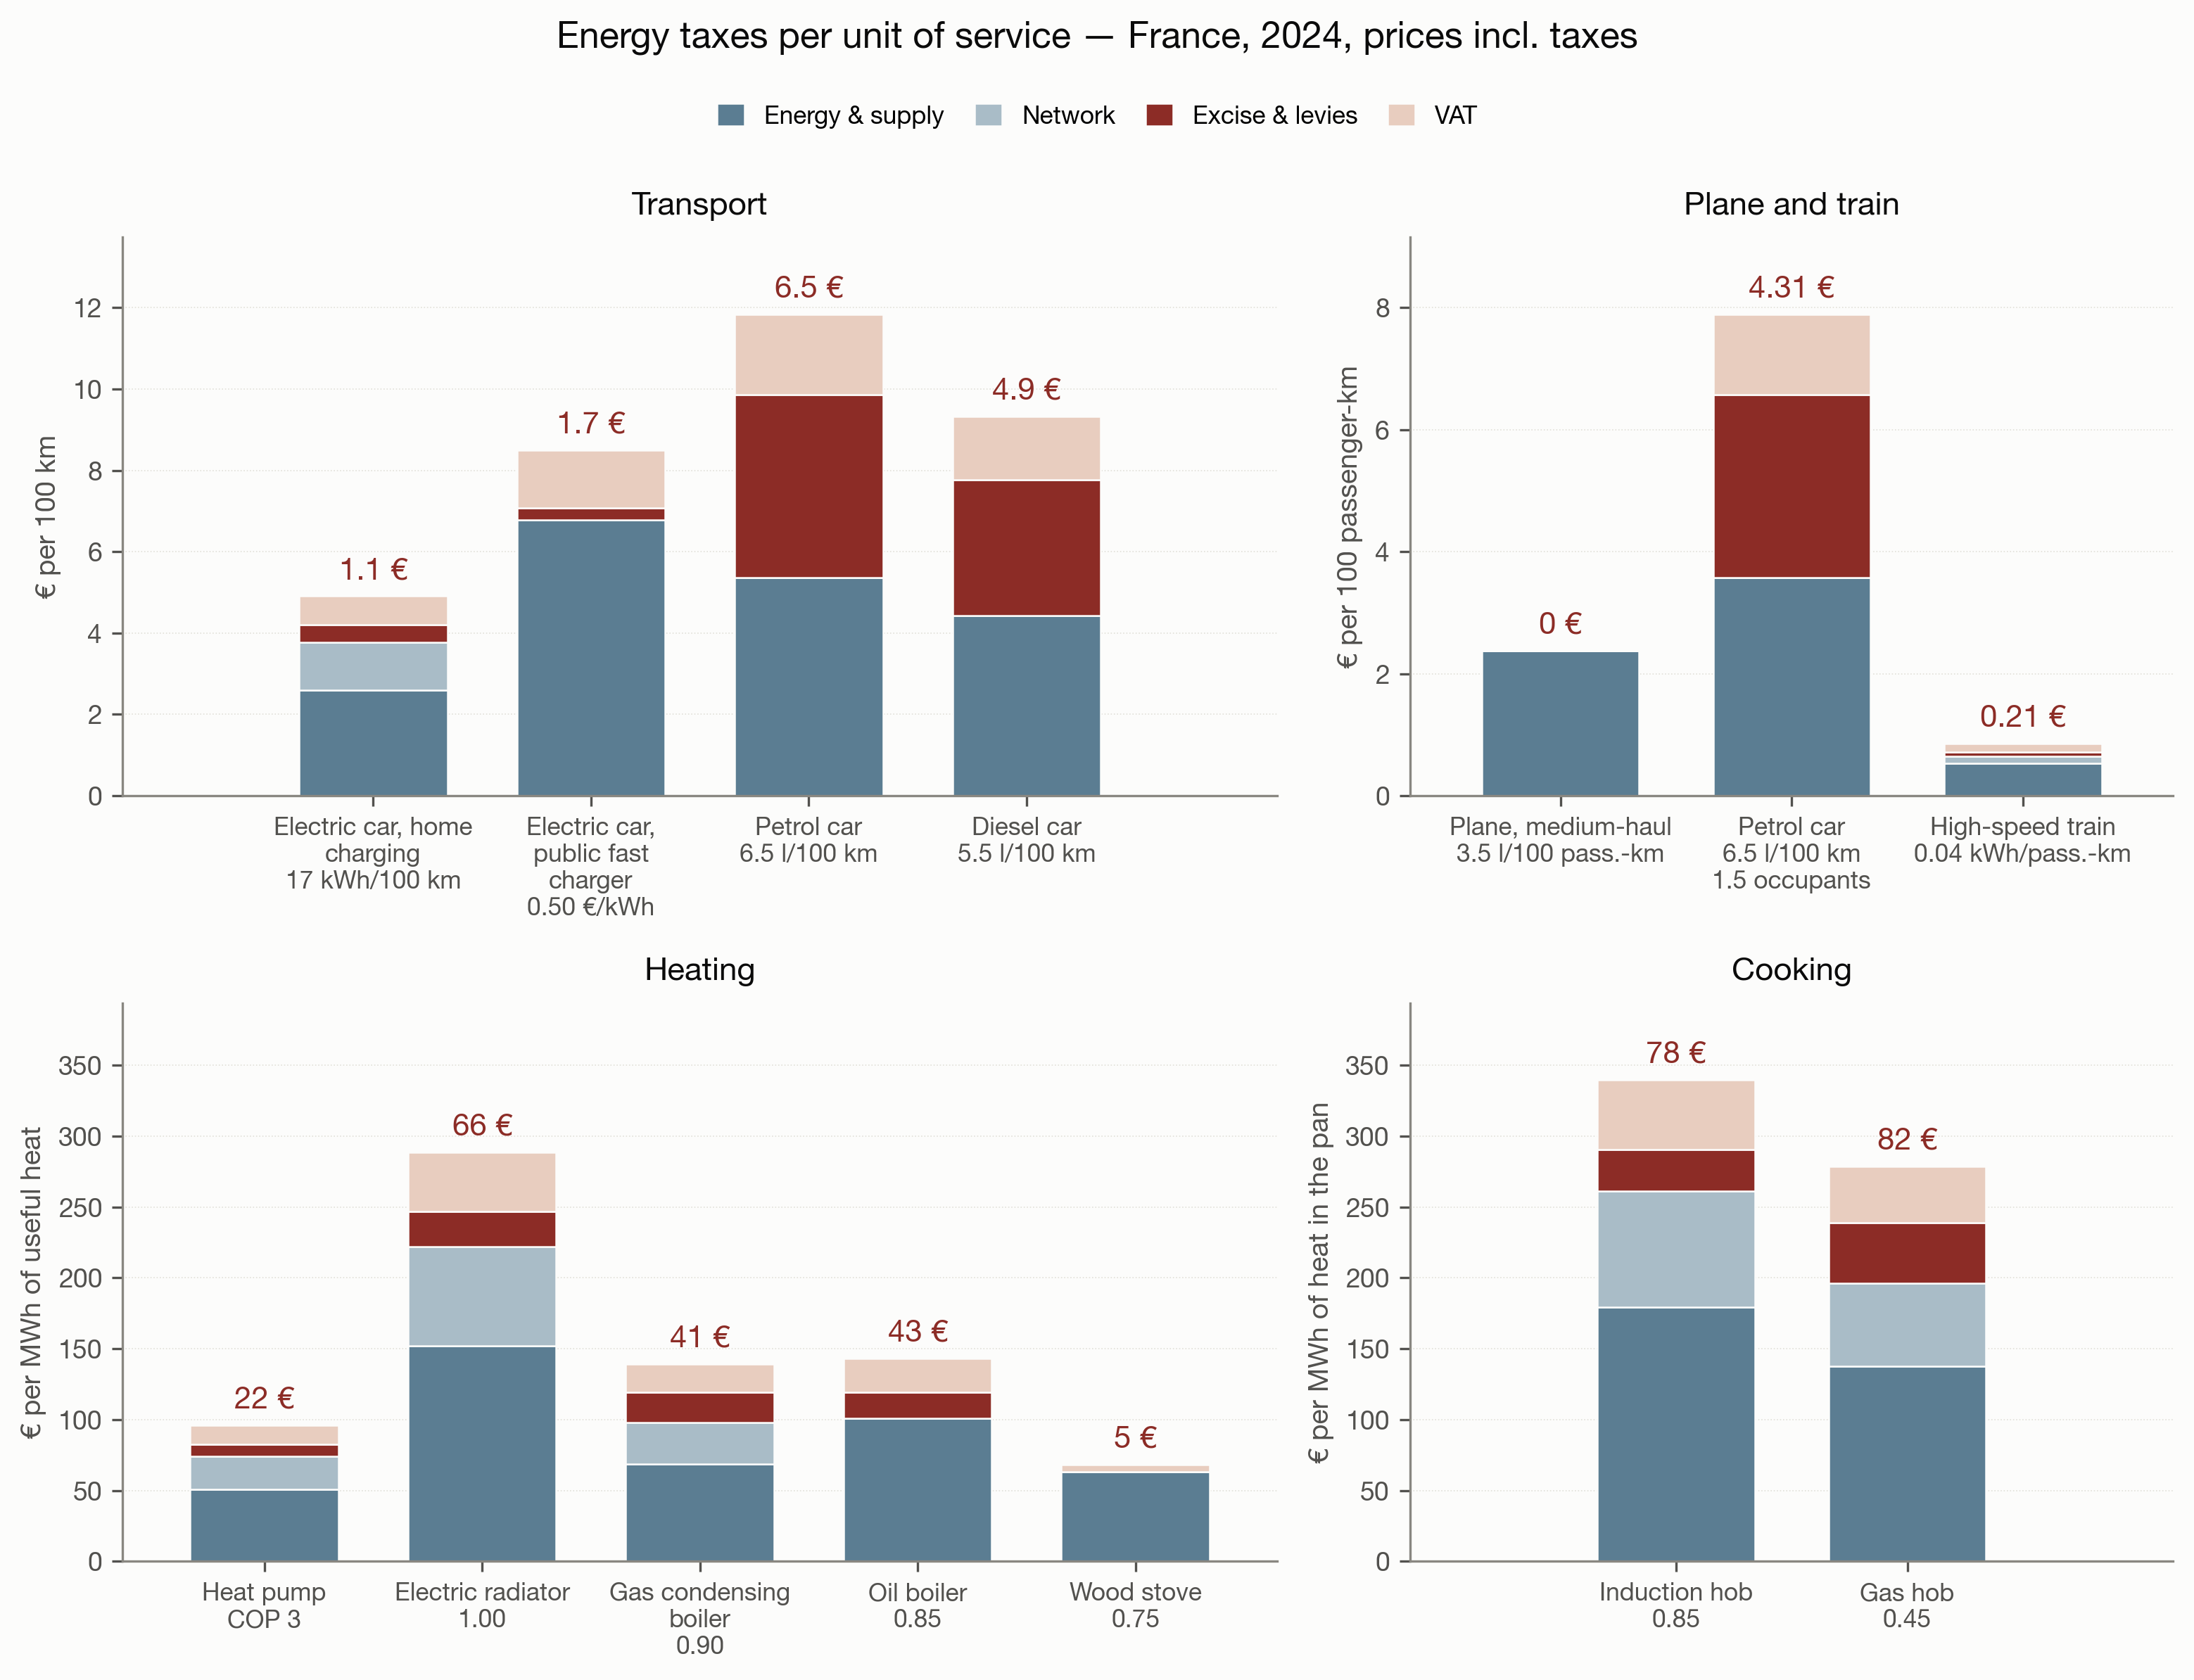
The same figure, to explore — and the year is yours
The four panels of the post, one use at a time, with the vintage of your choice: 2024, that of the post’s figure, or 2025. The vertical scale is computed over both years, so that switching year moves the bars and not the axis; heating and cooking share it, as in the figure. Hover a bar for its breakdown and the share of levies; the “table” view gives the numbers. Generated from the CSV of the plotted bars, below, by build_interactif.py.
The vintage is 2024, the same as the previous post, so that the two figures can be read together — and it is also the last year for which international bunker kerosene is published, hence the last one with a “plane” bar. The excise on electricity was then still reduced by the price shield (25.0 €/MWh in 2024 against 37.1 in 2025): it is the vintage most favourable to electricity. With 2025 prices — the “2025” button of the chart above, or the same command with
--annee 2025— one gets 26 € of levies per MWh of useful heat for the heat pump against 45 for the gas boiler, 77 for the electric radiator, the cooking tie holds (91 against 90) and the high-speed train stays at 0.21 € against 4.24 € by car per 100 passenger-km. The ranking does not depend on the vintage.
The text of the post
Energy taxes, by use and by carrier
Many of you rightly pointed out, under my last posts, that a MWh of electricity costs more and is taxed more than a MWh of gas, but that the two do not compare. That is quite true. Electricity is worth more than gas, per MWh. But it obviously depends on the use. A heat pump is three times more efficient than a gas boiler, an electric motor three times more than an internal combustion engine. Put that same electricity in a resistive radiator or an induction hob, and the comparison changes again.
So here is a description of the price of energy, and of the taxes that come with it, by use. France, 2024, prices including taxes.
I am also putting every one of my LinkedIn posts on my blog, with the data and the code (thanks Claude) behind these charts. The figures there are a little more complete, and interactive. Here, for instance, you can switch the vintage: with 2025 prices the gaps narrow, but the ranking does not change.
https://www.energy-alternatives.eu/en/linkedin.html
Sources: Eurostat, the Weekly Oil Bulletin and the SDES energy balance for prices; ADEME, Flamme Verte, DGAC and SNCF for efficiencies and consumptions. Everything is there, assumption by assumption.
EDIT, following a question in the comments: the height of a bar is not a price per litre, it is the price of energy including taxes for one unit of service — 100 km for cars, 100 passenger-km for plane and train, one MWh of useful heat for heating. The red figure above it is the total of taxes in that same unit. A petrol car at 6.5 l/100 km: 11.84 € per 100 km, of which 6.5 € of taxes.
Four clarifications about the figure
- The factor six between the electric and the petrol car compares levies per 100 km, not rates: a petrol car pays 55 % of taxes in its pump price, an electric car charged at home 23 % in its electricity bill. The factor six comes first from the efficiency of the motor (17 against 56 kWh per 100 km), then from the tax schedule.
- The heat pump is taken at COP 3, a seasonal average. In cold spells an air-air heat pump falls towards 2, and levies per MWh of useful heat then rise to 33 € — still below the 41 € of the gas boiler.
- Plane and train are not in the same unit as the cars of the first panel: 100 passenger-km, not 100 vehicle-km. The “plane” bar is fuel alone, exempt from excise and, on international flights, from VAT; a domestic flight has the same bar, and what it pays on top — 10 % VAT and the solidarity tax (2.63 € per passenger in economy class within France/EU in 2024) — falls on the ticket, not on the energy. The high-speed train is drawn at the industrial electricity price for want of a published rail price: the operator buys cheaper and deducts VAT, so its 0.21 € of levies is an upper bound (0.07 € of excise alone).
- Public fast charging is an assumption (0.50 €/kWh incl. VAT): only VAT and the excise paid by the operator are identifiable in it, the charger’s network tariff and the operator’s margin are counted with energy. The levies of that bar, 1.7 € per 100 km, are therefore a lower bound.
Sources
- Eurostat, prix de l’électricité pour les ménages par composante (nrg_pc_204_c)
- Eurostat, prix du gaz pour les ménages par composante (nrg_pc_205_c)
- Commission européenne, Weekly Oil Bulletin (essence, gazole et fioul, prix avec et hors taxes)
- SDES, Bilan énergétique de la France (bois de chauffage : dépense et fiscalité des ménages)
- ADEME, Base Carbone / Base Empreinte (pouvoirs calorifiques des carburants, rendements des équipements de chauffage)
- Label Flamme Verte, critères de rendement des appareils de chauffage au bois
- Règlement (UE) n° 66/2014 (écoconception des appareils de cuisson) et norme EN 60350-2, rendement des plaques
- Norme EN 14825 (SCOP des pompes à chaleur)
- Code des impositions sur les biens et services, art. L. 312-58 (exonération d’accise du carburant de l’aviation commerciale)
- DGAC, chiffres et statistiques du transport aérien (consommation de carburant par passager-kilomètre)
- SNCF, empreinte environnementale des mobilités (consommation et émissions du TGV par voyageur-kilomètre)
- SDES, Enquête mobilité des personnes 2019 (taux d’occupation moyen des voitures)
Data
donnees_taxes_usage_fr_2024_2025.csv— The bars as plotted, 2024 and 2025 vintages: for each appliance, the four components in euros per unit of service, the price incl. taxes, the levies, the assumption used and the unit. This is what the interactive chart above reads. Four units coexist in the file — theunite_frcolumn says which, and two rows with different units do not add up.donnees_facture_fr_mwh_2024_2025.csv— The twelve “per MWh delivered” bars of the previous post, 2024 and 2025 vintages, in €/MWh: energy, network, excise, VAT, price incl. taxes, levies and their share. It is the starting point of the three panels.hypotheses_usages.csv— Every use assumption read by the script: consumptions (kWh or litres per 100 km, per 100 passenger-km), occupancy, calorific values, efficiencies and COP, each with its source and its degree of confidence. None is hard-coded in the script, and the unit of each consumption is written there — it is the unit that drives the conversion.
Code
The code that produces the figure is in the public repository linkedinposts, folder energy_taxes.
To reproduce the figure:
cd energy_taxes
# la figure du post : sans le bloc de notes, illisible sur un fil LinkedIn
python3 plot_taxes_usage.py --paysage --lang fr --sans-note
python3 plot_taxes_usage.py --paysage --sans-note   # version anglaise
python3 plot_taxes_usage.py --paysage --lang fr     # avec les notes (PDF, diapo)
python3 plot_taxes_usage.py                         # portrait, anglais
python3 plot_taxes_usage.py --annee 2025            # le millésime suivant
# les barres des deux millésimes, ce que lit le graphique interactif
python3 plot_taxes_usage.py --export-csv output/taxes_usage_fr_2024_2025.csv \
    --annees 2024 2025
plot_taxes_usage.py reuses the loaders of plot_facture.py (Eurostat, Weekly Oil Bulletin, SDES energy balance): both figures rest on the same numbers, and the script prints the gap with the published CSV of the previous post. --source csv rebuilds the figure from that CSV alone, without the primary sources.
All files of this post (figures, data, scripts) are in the folder 2026-09-12-taxes-a-l-usage of the public repository.
Code under the MIT licence; texts and figures under CC BY 4.0; data remain under their producer’s licence.