The text of the post
Energy inequality and the transition. I am continuing with energy prices, but from the point of view of the burden on consumers: its long-term evolution on average, and its distribution today — well, in 2020.
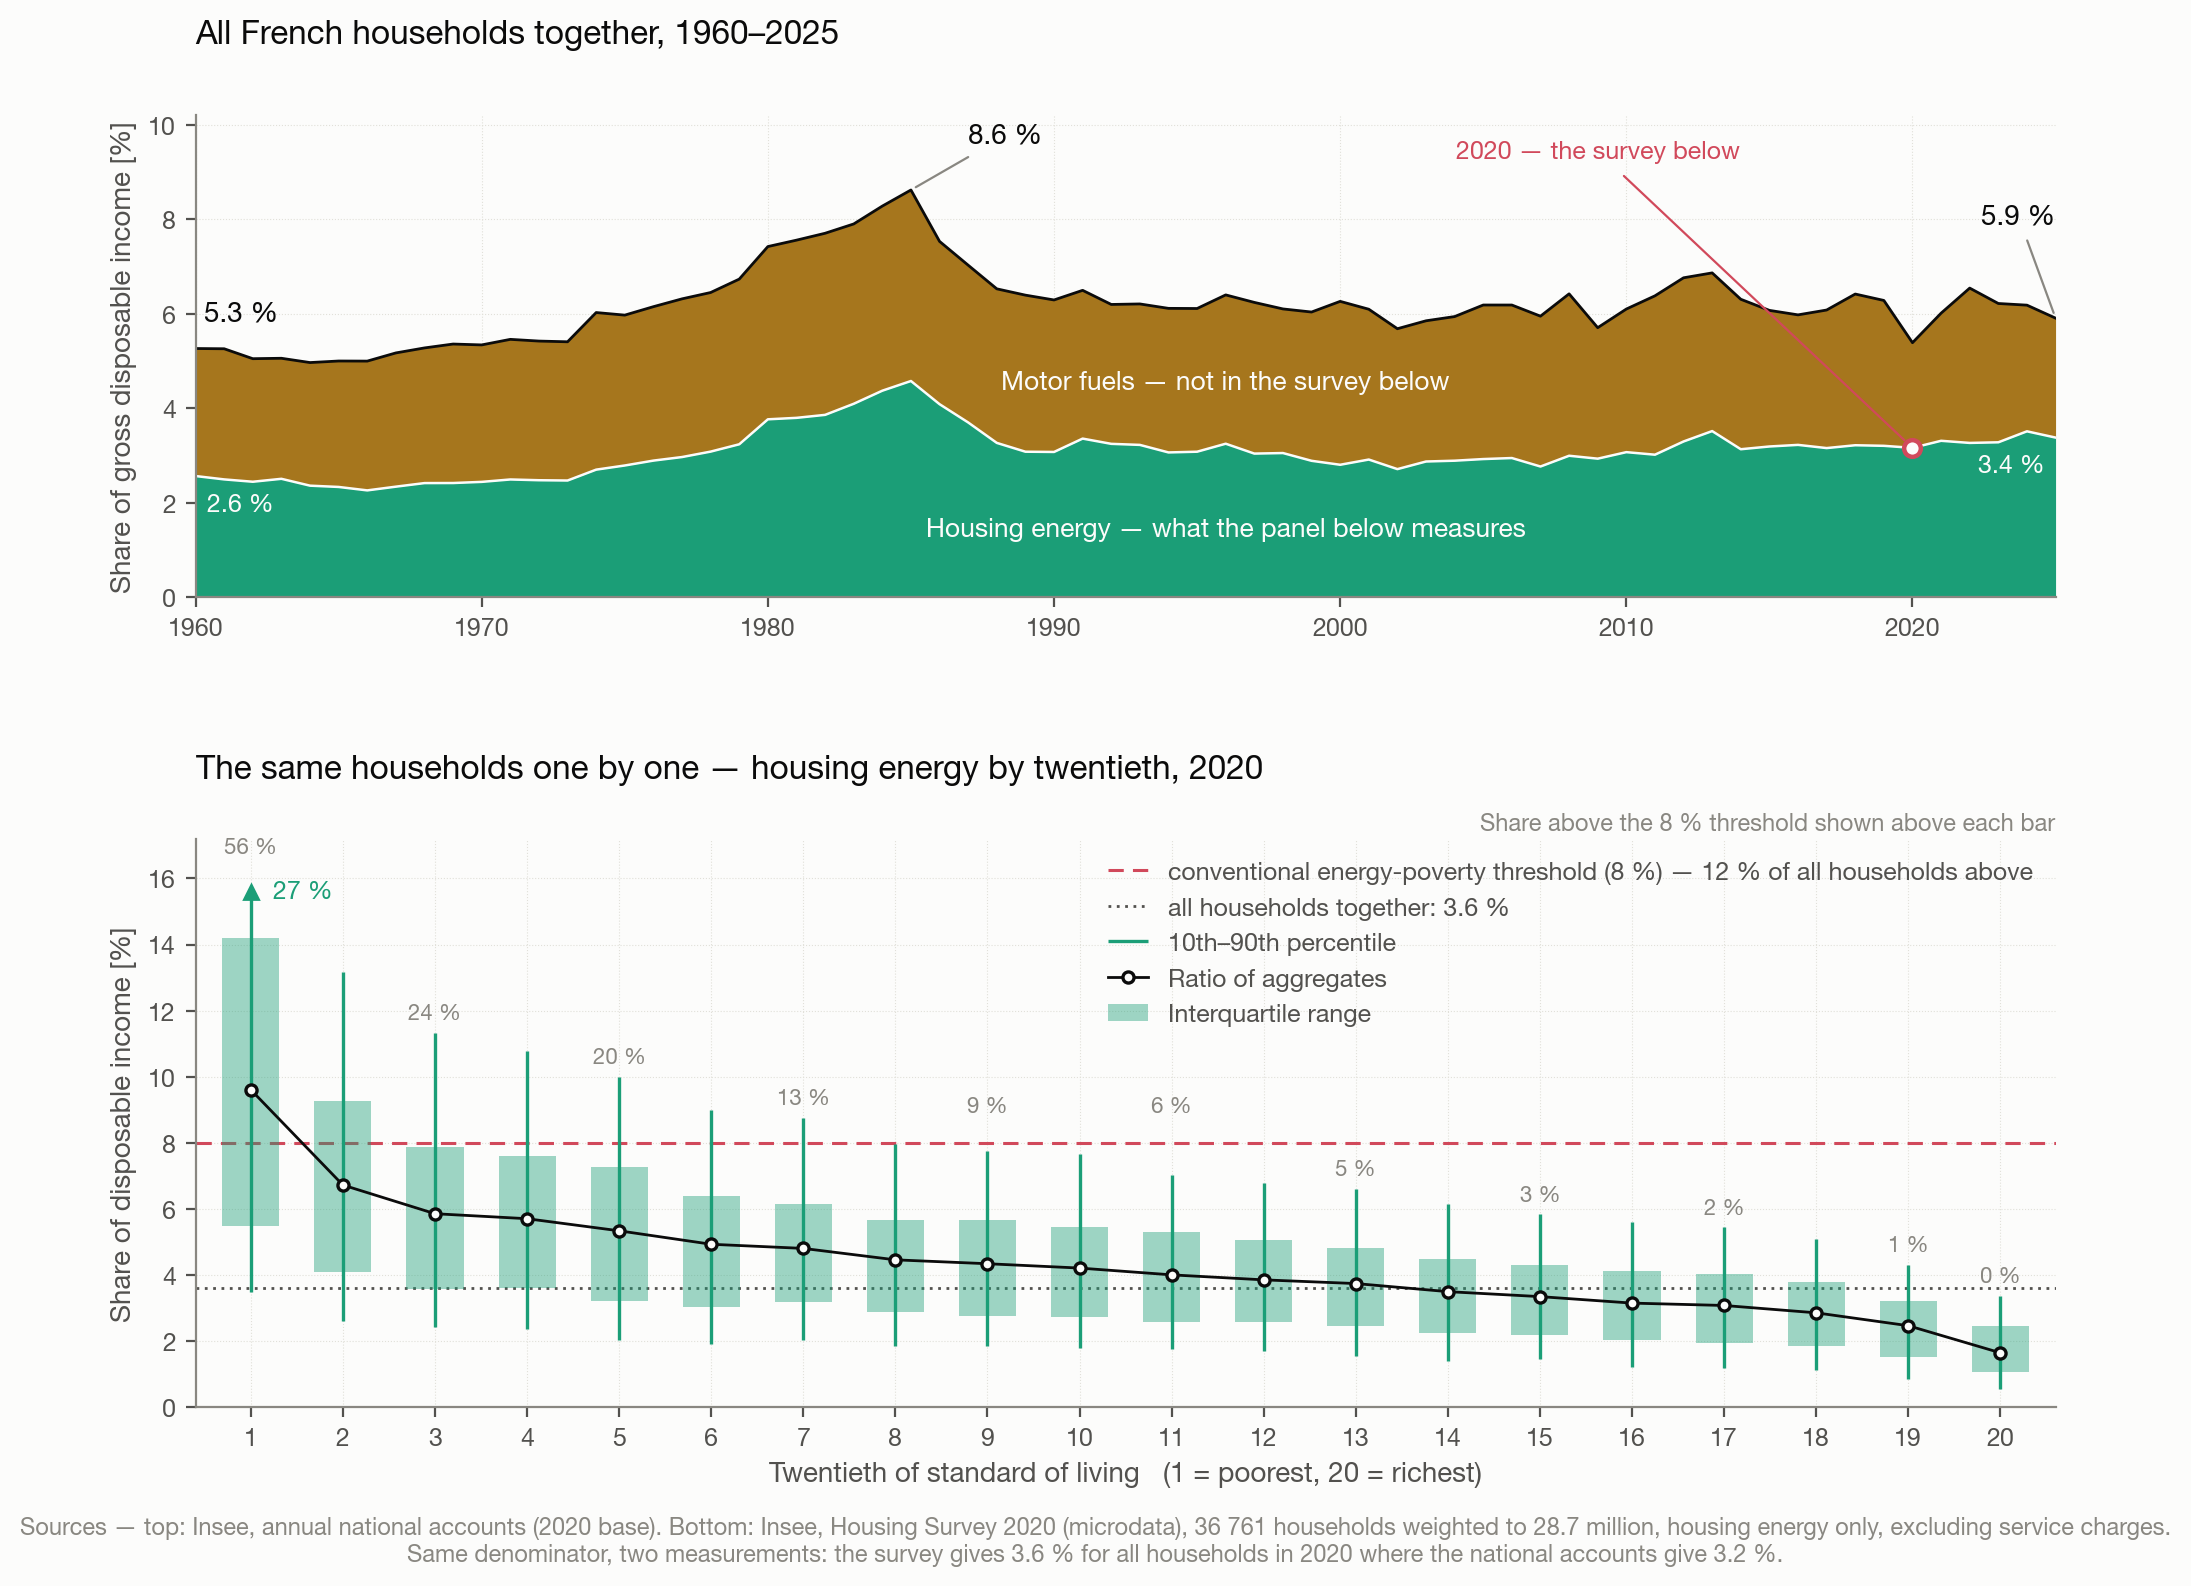
The top chart shows the share of income the French spend on their direct energy, motor fuels included, in brown. It rises from the first oil shock onwards, and the main contributor is electricity: its real price barely moved over the period, so this is a volume effect — electric heating spreading, made possible by the nuclear fleet — rather than a cost effect. Then the fall of the 1986 counter-shock, around 1985, amplified by the collapse of the dollar at the time. Otherwise, the least one can say is that this share does not move much. We consume what we can afford to consume — or perhaps taxes adjust to what we can afford to pay. I will come back to this.
The bottom chart shows the distribution, excluding motor fuels: that allows us to use the 2020 housing survey, whose microdata make it possible to go down to the twentieth. On this spending excluding fuels, the 8 % threshold is used to define energy poverty, and about 12 % of households are above it in 2020.
That is less than before: the same survey gave 22 % at the end of the 1980s (though about the same as today back in 2006). I am curious to see the 2026 figures.
It is still a lot, and too much. The people hit by this poverty often cannot even live decently. And it is that part of the French population we should help when energy prices spike, as during the Ukraine crisis. We are still paying for the tariff shield, which delivered support uniformly to everyone, where only a fraction of them needed it. I find our response to Hormuz better proportioned, and we are developing solutions such as the electric vehicle. It must be said that the budget is tight.
But budget austerity must not make us miss the double necessity of the energy transition we have to carry out, for our independence and for the environment. On the one hand, we must bring everyone into a common project, and that means pushing energy poverty back with targeted support. On the other, the transition is above all investment — retrofits, renewables, nuclear: CAPEX for OPEX savings.
Sources: Insee, annual national accounts (2020 base) for the long series; Insee, national housing survey 2020 and earlier vintages (microdata, Progedo access) for the distribution.
The code, the data and the checks are on my blog, along with all my LinkedIn posts (link in the comments).
Sources
- Insee, comptes nationaux annuels, consommation effective des ménages par produit (base 2020)
- Insee, évolution du revenu disponible brut et du pouvoir d’achat (taux d’épargne)
- Insee, Enquête nationale logement 2020 (microdonnées via Progedo-Adisp, DOI 10.13144/lil-1602)
- Insee, Enquêtes nationales logement 1988 à 2006 (microdonnées Progedo-Adisp) — la série à méthode constante
- ONPE, tableau de bord de la précarité énergétique (cité en commentaire, pas sur la figure)
Data
charge_rdb_fr.csv— The top panel: the 1960-2025 series — share of housing energy, motor fuels and the total in gross disposable income.tee_enl2020_vingtiemes.csv— The bottom panel: by twentieth of living standard, the ratio of aggregates, quartiles, extreme deciles, the share above 8 %, and average bill and income (housing survey 2020).tee_enl_serie_deciles.csv— The six usable vintages of the housing survey, 1988 to 2020, on a constant method: the source of the 22 % at the end of the 1980s and of the comparison with 2006. Not on the figure.
Code
The code that produces the figure is in the public repository linkedinposts, folder prix_elec.
To reproduce the figure:
cd prix_elec
python3 prepare_data_fr_rdb.py                      # Insee : la série longue sur le revenu disponible
python3 prepare_data_fr_distrib.py                  # les vingtièmes de l'ENL (accès Progedo)
python3 figure_vingtiemes_et_serie.py --lang fr     # sans --lang : anglais
The prepared CSV files are in the repository; only the housing-survey step requires access to the microdata.
All files of this post (figures, data, scripts) are in the folder 2026-09-14-charge-energetique-menages of the public repository.
Code under the MIT licence; texts and figures under CC BY 4.0; data remain under their producer’s licence.