The text of the post
I’ve just finished my first 51 short videos, all about decarbonising heavy industry: steel, cement, aluminium, hydrogen, ammonia, plastics, industrial heat. Here is a 9-page summary to make you want to watch them on YouTube or Instagram (links in the comments).
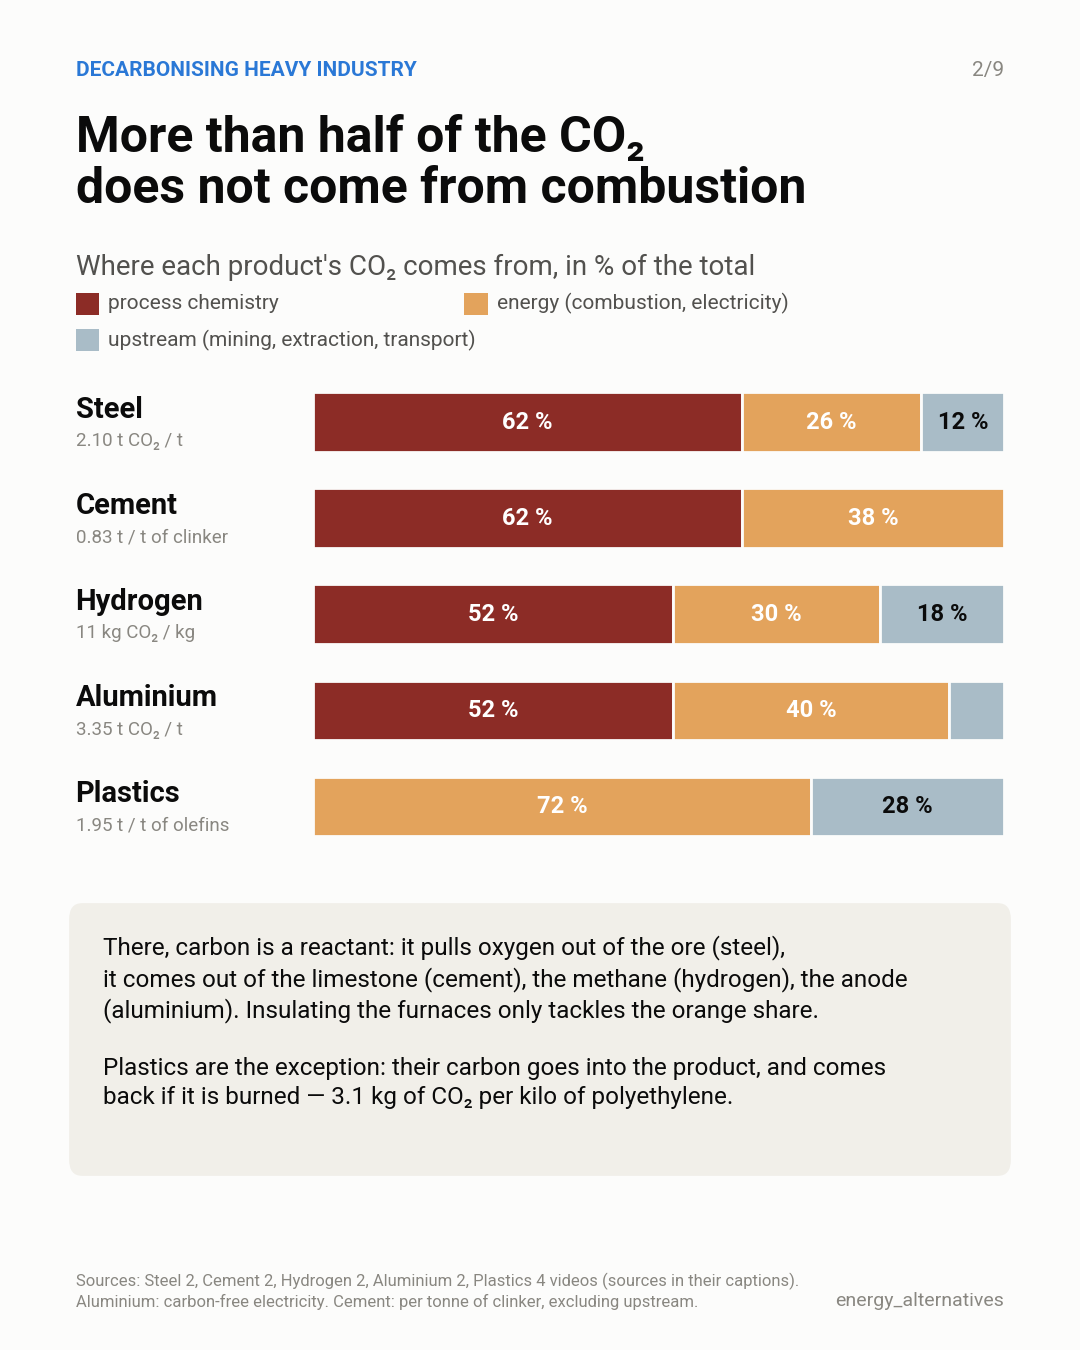
In steel, cement, hydrogen and aluminium, more than half of the CO2 comes from process chemistry, not combustion. There, carbon is a reactant: it strips oxygen from the ore, it comes out of the limestone, the methane, the anode. Insulating the furnaces therefore only tackles part of the problem. Four levers remain — recycling, electrifying heat, changing the chemistry, capturing — and one shared condition: low-carbon electricity. On the average European grid, an electrolyser produces hydrogen that emits more than the steam reforming it replaces.
The point of these videos is not to feed a news feed, but to build knowledge: industry by industry, verified, reusable content for teaching and explaining decarbonisation. Most start from a real French plant and follow the line workshop by workshop; all cite their sources, and every figure in this summary comes from one of them.
The COP series has just ended: nine videos to understand what a COP decides, and what it doesn’t; the last one came out this morning.
The next series is almost ready: the life of an industrial project. A decision, permits, sometimes years of opposition, a construction site, decades of operation, ageing, then an end that doesn’t always come. From the high-speed line to the Fos high-voltage line, via power plants and wind farms: each stage has its own duration, and each weighs on what the project will cost. Only then comes the notion — not so simple — of cost.
Some of the videos also exist in English.
Sources
Code
To reproduce the figure:
# dans Communication/Reels/atelier/industrie/carrousel_solutions/
python3 build_carrousel.py --linkedin    # 9 pages PNG + carrousel_industrie_fr.pdf (figure_chimie_fr.png = page 2)
# dans le dossier du post :
python3 build_figure_chimie_en.py        # figure_chimie_en.png (même page 2, en anglais)
No new calculation: every figure is taken from a published video (provenance in CHIFFRES.md); only the percentages on page 2 are computed.
All files of this post (figures, data, scripts) are in the folder 2026-11-17-series-industrie-bilan of the public repository.
Code under the MIT licence; texts and figures under CC BY 4.0; data remain under their producer’s licence.