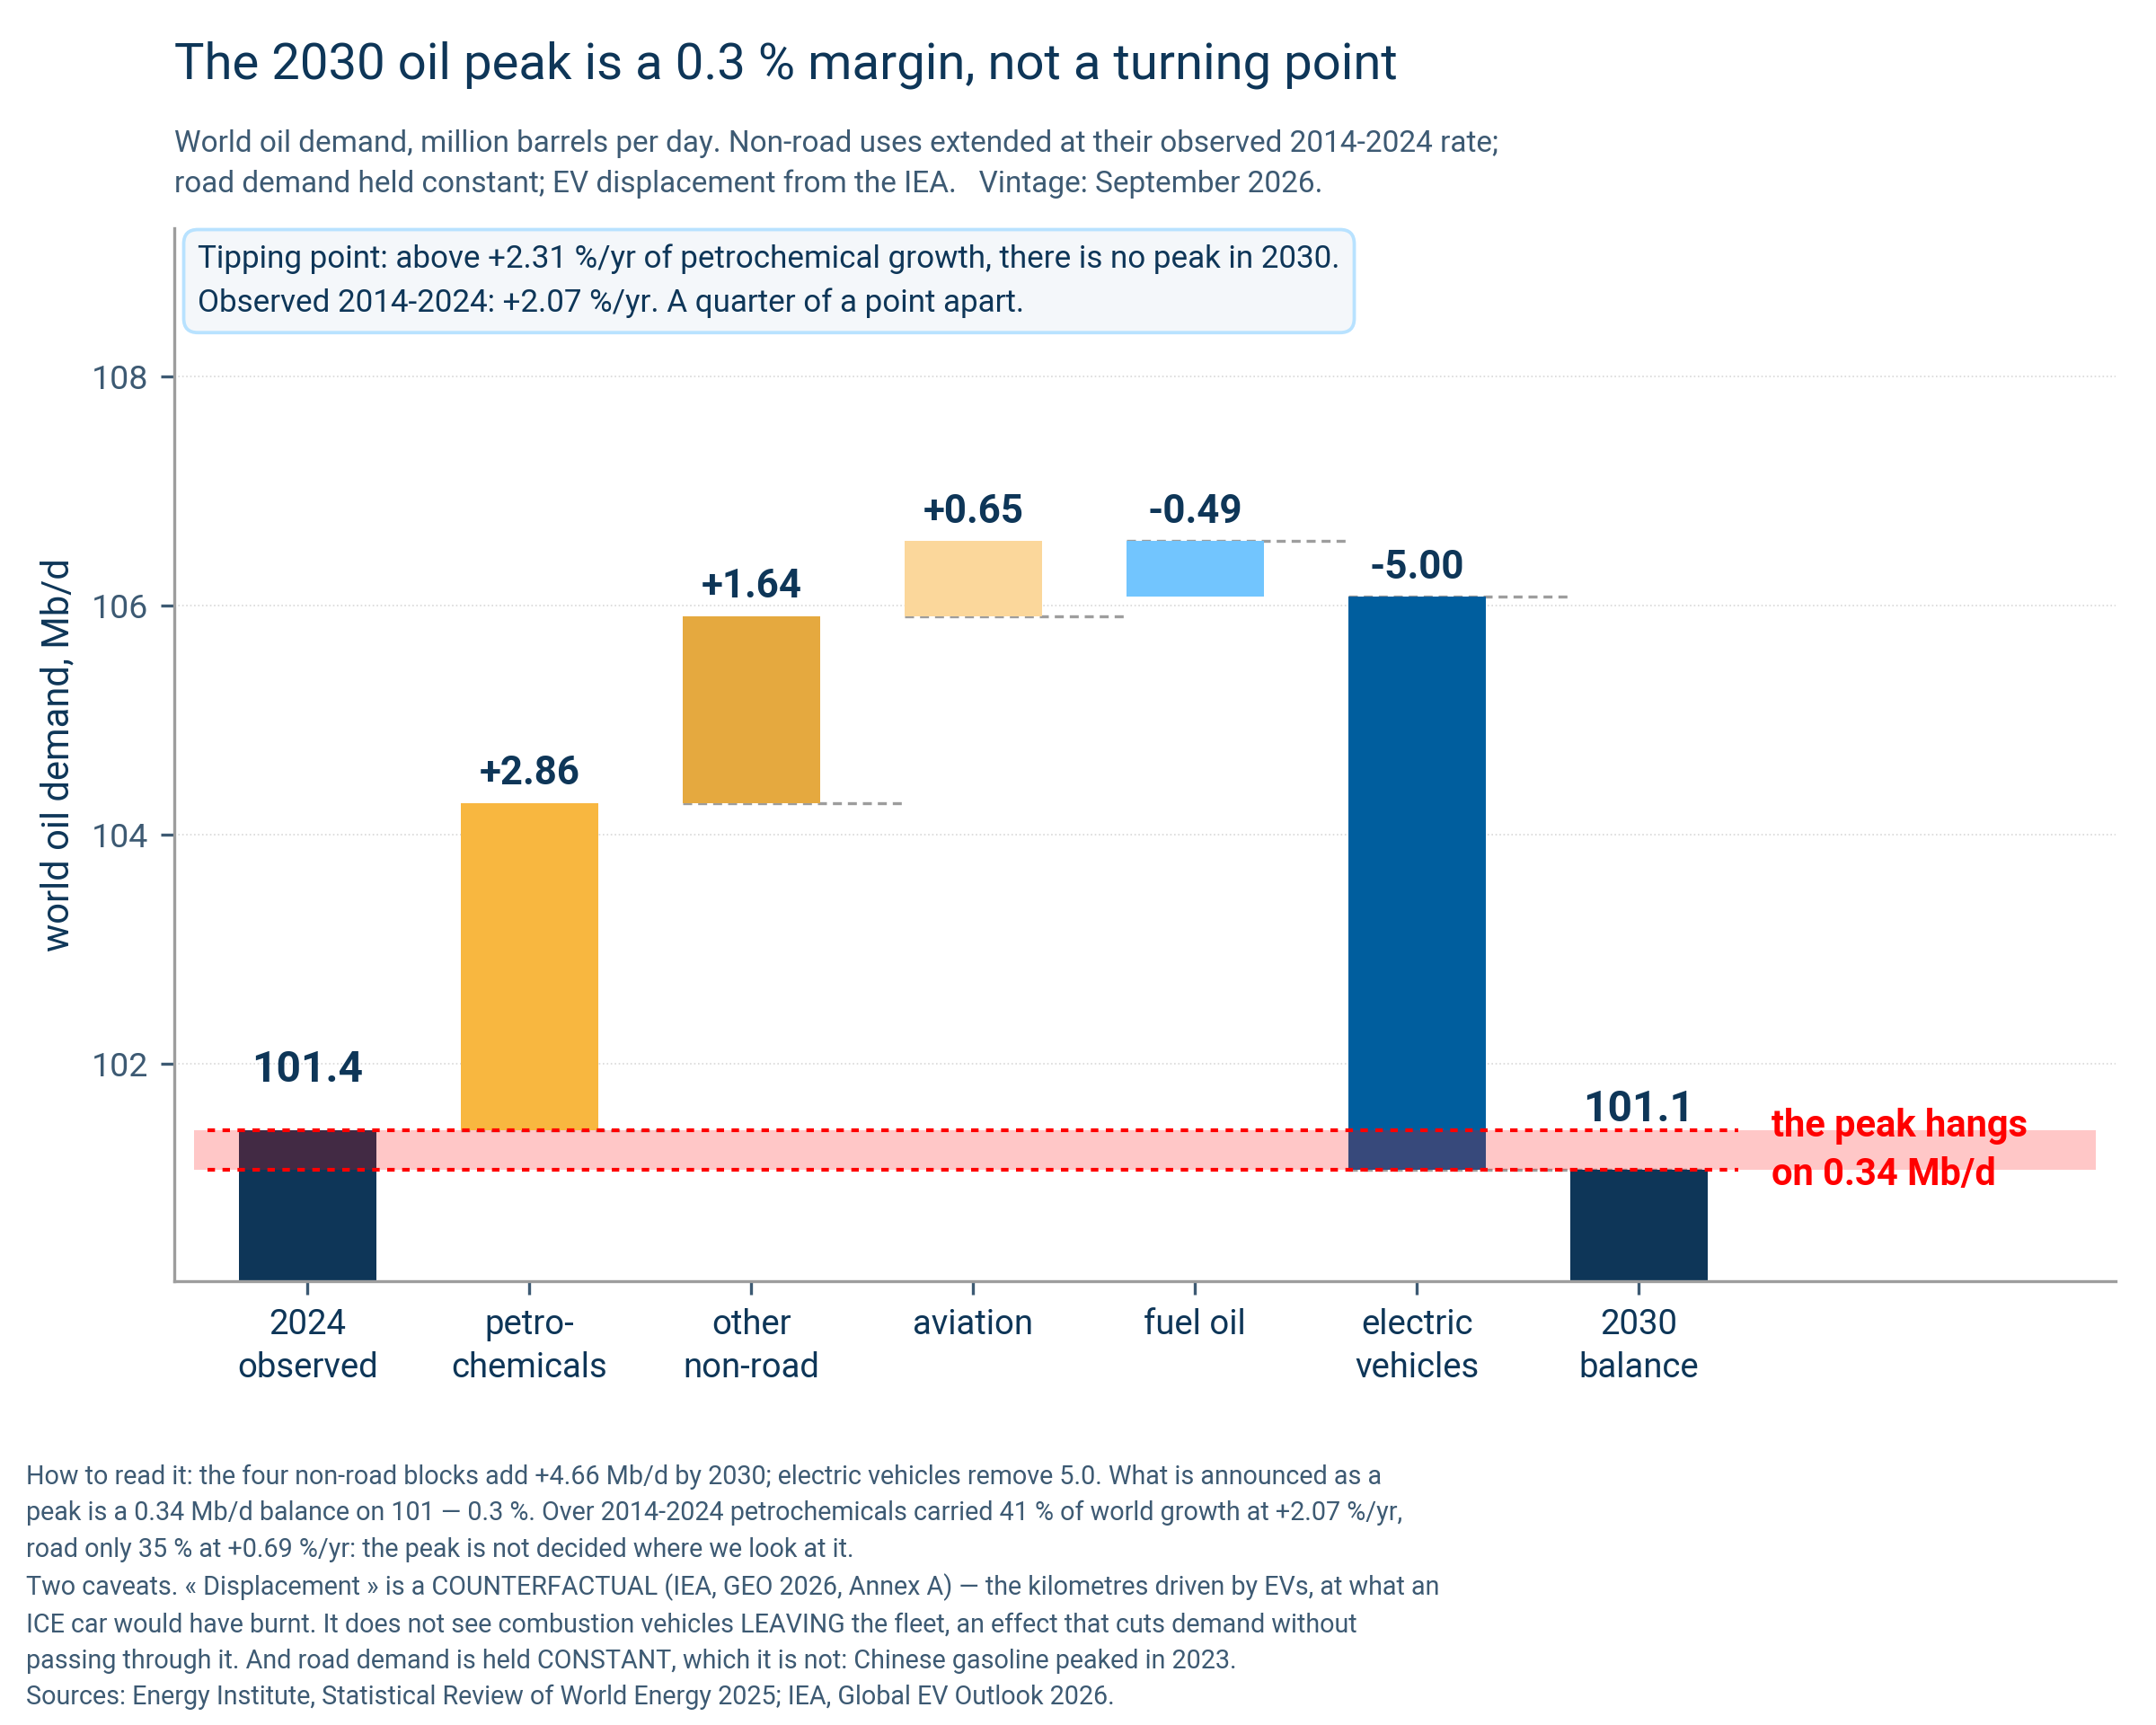
The “+2.86” extends the 2014-2024 pace, it is not a forecast. The IEA’s “displacement” is a counterfactual (electric kilometres at a combustion car’s litres): it does not see combustion cars leaving the fleet, an effect that brings the peak closer and is not in the figure.
The text of the post
Electric vehicles push oil demand down. Plastics push it back up. Which one wins?
By 2030, the IEA expects the world’s electric cars to remove 5 million barrels a day. If petrochemicals keep growing at their pace of the last ten years, +2.1% a year, they put nearly 3 back. Add bitumen, lubricants and aviation, and the non-road increase reaches 4.7. On 101 million barrels a day, the 2030 peak hangs on 0.3%. A quarter of a point more petrochemical growth, and there is no peak.
This is not new. Between 2014 and 2024, world oil demand grew by 10 million barrels a day. Petrochemicals carried 41% of it, road transport 35%. For ten years now, cars have not been what pulls oil.
In China the crossing has already happened. Gasoline and diesel have been falling since 2023, thanks to electric cars and LNG trucks. Yet in 2024 China consumed more oil: its petrochemical feedstocks grew by 5%. Between 2019 and 2024 it added as much ethylene and propylene capacity as Europe, Japan and Korea combined. What the electric car took from the pump, the steam cracker took back.
Two caveats. The IEA’s “displacement” counts the kilometres driven electric at the litres a combustion car would have burned: it does not see the combustion cars leaving the fleet, and that exit is what decides. China’s combustion fleet stopped growing in 2025, which was my September post. And 2026 is an oil-shock year: a cyclical dip is not a peak.
Still, reducing plastics has become an oil question. Not all plastics. Medical plastics, syringes, bags, gloves, we keep, and they weigh little. Transition plastics too: all the wind turbines installed in Europe in a year amount to less than half a percent of Europe’s plastics. The big volume is single-use packaging, 40% of the world’s plastic waste, for a few months of use, sometimes a few minutes.
That is the thread of the eleven short videos on plastics I am finishing this week: where it comes from, what it contains, where it ends up, and the three Rs, reduce, recycle, defossilise what remains. The eighth, “Reduce”, walks through exactly this calculation.
Sources, reproducible calculation and links to the videos in the first comment.
Two rates not to be confused
- Plastics output grows by about 3.6% a year in tonnes (OECD, 2000-2019). The oil item that feeds it, ethane, LPG and naphtha, grows by only 2.07% a year: a growing share of feedstock comes from gas, not from the barrel. The calculation uses the oil item.
Sources
- Energy Institute, Statistical Review of World Energy 2025 — demande mondiale de pétrole par produit raffiné, 1980-2024
- AIE, Global EV Outlook 2026 — le déplacement de pétrole par les véhicules électriques (≈ 5 Mb/j en 2030) et sa définition contrefactuelle en annexe A
- AIE, Oil demand for fuels in China has reached a plateau (mars 2025) — carburants en baisse, charges pétrochimiques + 5 % en 2024
- AIE, China’s petrochemical surge is driving global oil demand growth — autant d’éthylène et de propylène ajoutés en 2019-2024 que l’Europe, le Japon et la Corée réunis
- OCDE, Global Plastics Outlook 2022 — l’emballage, 40 % des déchets plastiques mondiaux (2019)
- Les onze vidéos « Plastique », avec leurs sources et leur code
Data
donnees_regions_petrochimie_route_kbj.csv— Oil demand by region (China, EU, Europe, US, India, Japan, Asia-Pacific, Middle East, World), 1965-2024, thousand barrels a day: petrochemicals (naphtha + ethane/LPG), road (gasoline + diesel), jet kerosene, total (Energy Institute 2025, “Oil - Regional Consumption” sheet).donnees_owid_production_plastique.csv— World plastics production 1950-2019, tonnes (Our World in Data after Geyer et al. 2017 and OECD 2022).donnees_petrole_par_produit_kbj.csv— World oil demand by refined product, 1980-2024, thousand barrels a day (Energy Institute 2025, World): ethane/LPG, naphtha, gasoline, jet kerosene, diesel/gasoil, fuel oil, others, total.
Code
The script calcul_bilan_2030.py produces the figure on its own.
To reproduce the figure:
python3 calcul_bilan_2030.py       # le bilan 2024 → 2030, le seuil de bascule et les sensibilités
python3 plot_carrousel.py          # les trois pages du carrousel, FR et EN, PNG et PDF
No modelling: two published series and a rule of three. The figure is rebuilt with plot_cascade_2030.py in Enseignement/Thematic_analysis/Ressources_fossiles/Pic_petrolier/.
All files of this post (figures, data, scripts) are in the folder 2026-10-27-plastique-contre-vehicule-electrique of the public repository.
Code under the MIT licence; texts and figures under CC BY 4.0; data remain under their producer’s licence.